10M eta's are thrown via EtaRegge and post-processed by evtgen where the eta's are decaying into all 10 possible decays listed in a DEC file. The figure below is showing the resulting distance between two bachelor photons for the eta to ggpi0 event candidates.
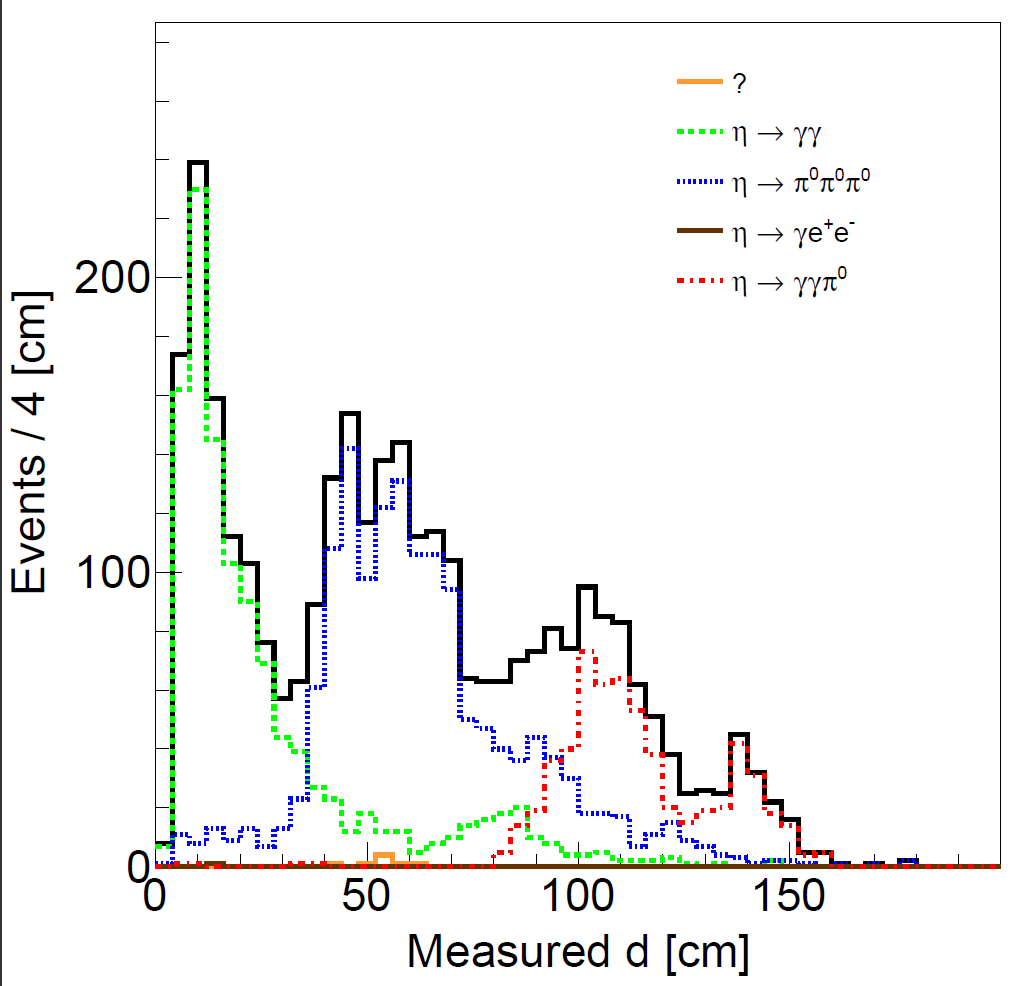
Now, if all individual decays are simulated individually but the number of events thrown is proportional to their branching ratio and post-processed by evtgen, the following distribution is obtained for the distance between two bachelor photons for the eta to ggpi0 event candidates.
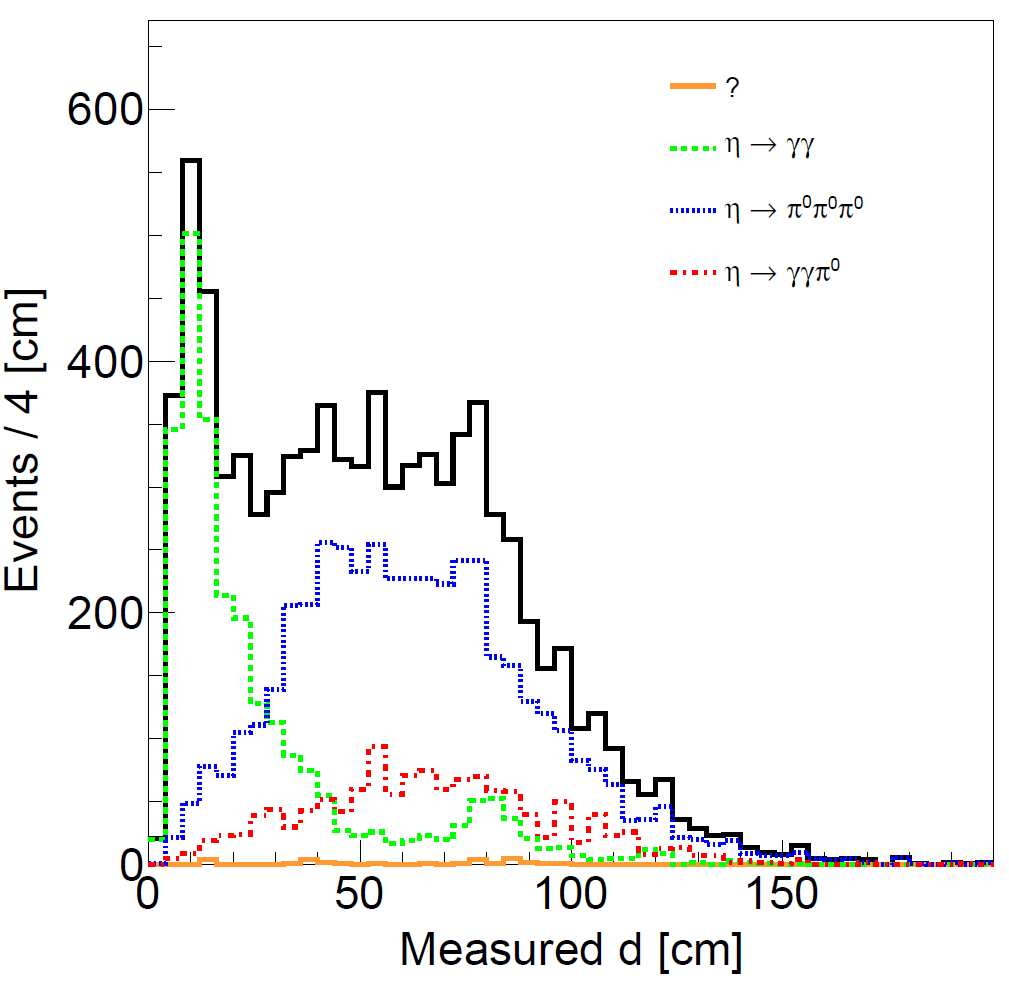
The first distribution where all decays are simulated in one bunch is wrong. Somehow evtgen is changing the kinematics when more than one possible decay is listed in the DEC file.
10M eta's are thrown via EtaRegge and post-processed by evtgen where the eta's are decaying into all 10 possible decays listed in a DEC file. The figure below is showing the resulting distance between two bachelor photons for the eta to ggpi0 event candidates.
Now, if all individual decays are simulated individually but the number of events thrown is proportional to their branching ratio and post-processed by evtgen, the following distribution is obtained for the distance between two bachelor photons for the eta to ggpi0 event candidates.
The first distribution where all decays are simulated in one bunch is wrong. Somehow evtgen is changing the kinematics when more than one possible decay is listed in the DEC file.