In this analysis, citibike user data from New York City was used to create visualizations in Tableau. The user data was recorded in August, a popular bike renting month. First, the original data file was updated using pandas in Jupyter Notebook to change the Trip Duration column to a Datetime Format that could be used in the analysis. Then worksheets were made in Tableau, displaying bike checkout times for users, checkout times by gender, trips by weekday per hour, trips by weekday per hour by gender, trips by weekday per gender, August peak hours, and gender breakdown of all users. After the worksheets were completed, they were compiled in a Tableau story, available from the link below.
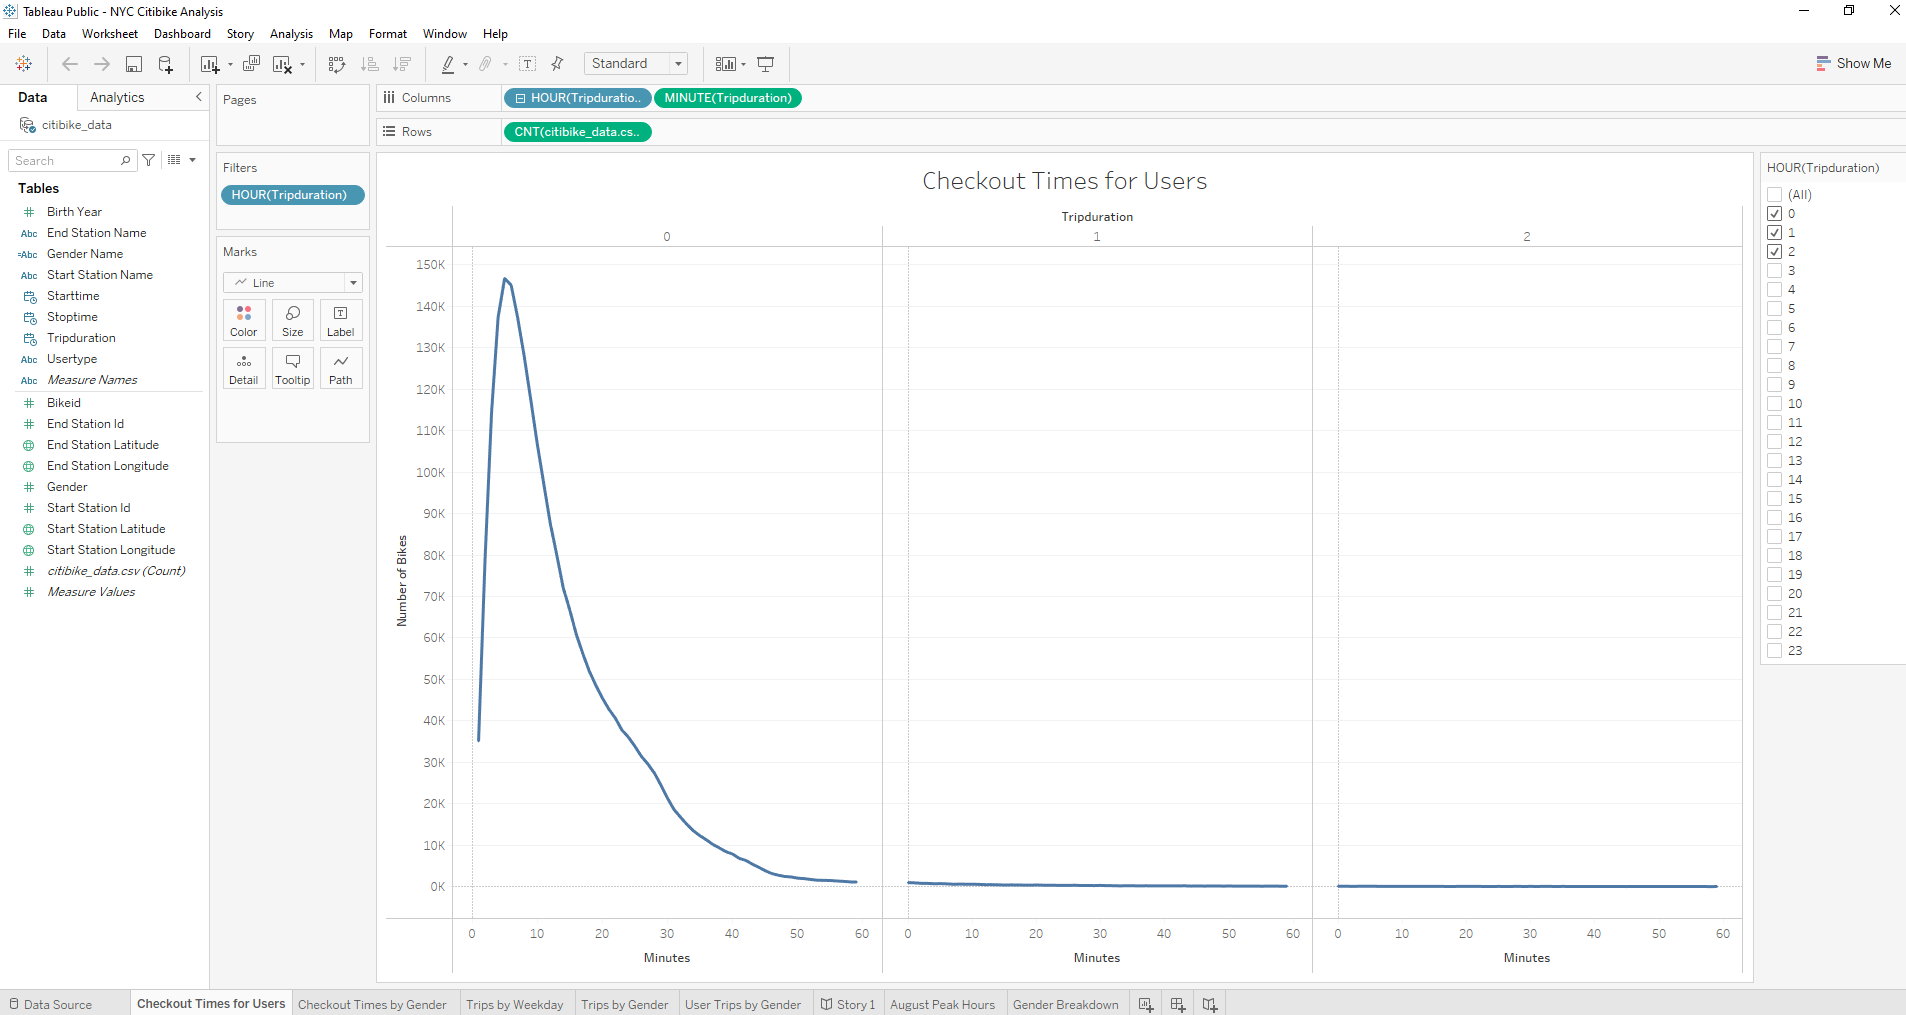
This line graph displays the amount of time all users rented their citibike in minutes on the bottom x-axis and hours on the top x-axis. The number of users is displayed on the y-axis. The graph shows most users checkout their citibikes for 5 minutes with a total of 146,752 users, and most bike checkouts are for less than 60 minutes.
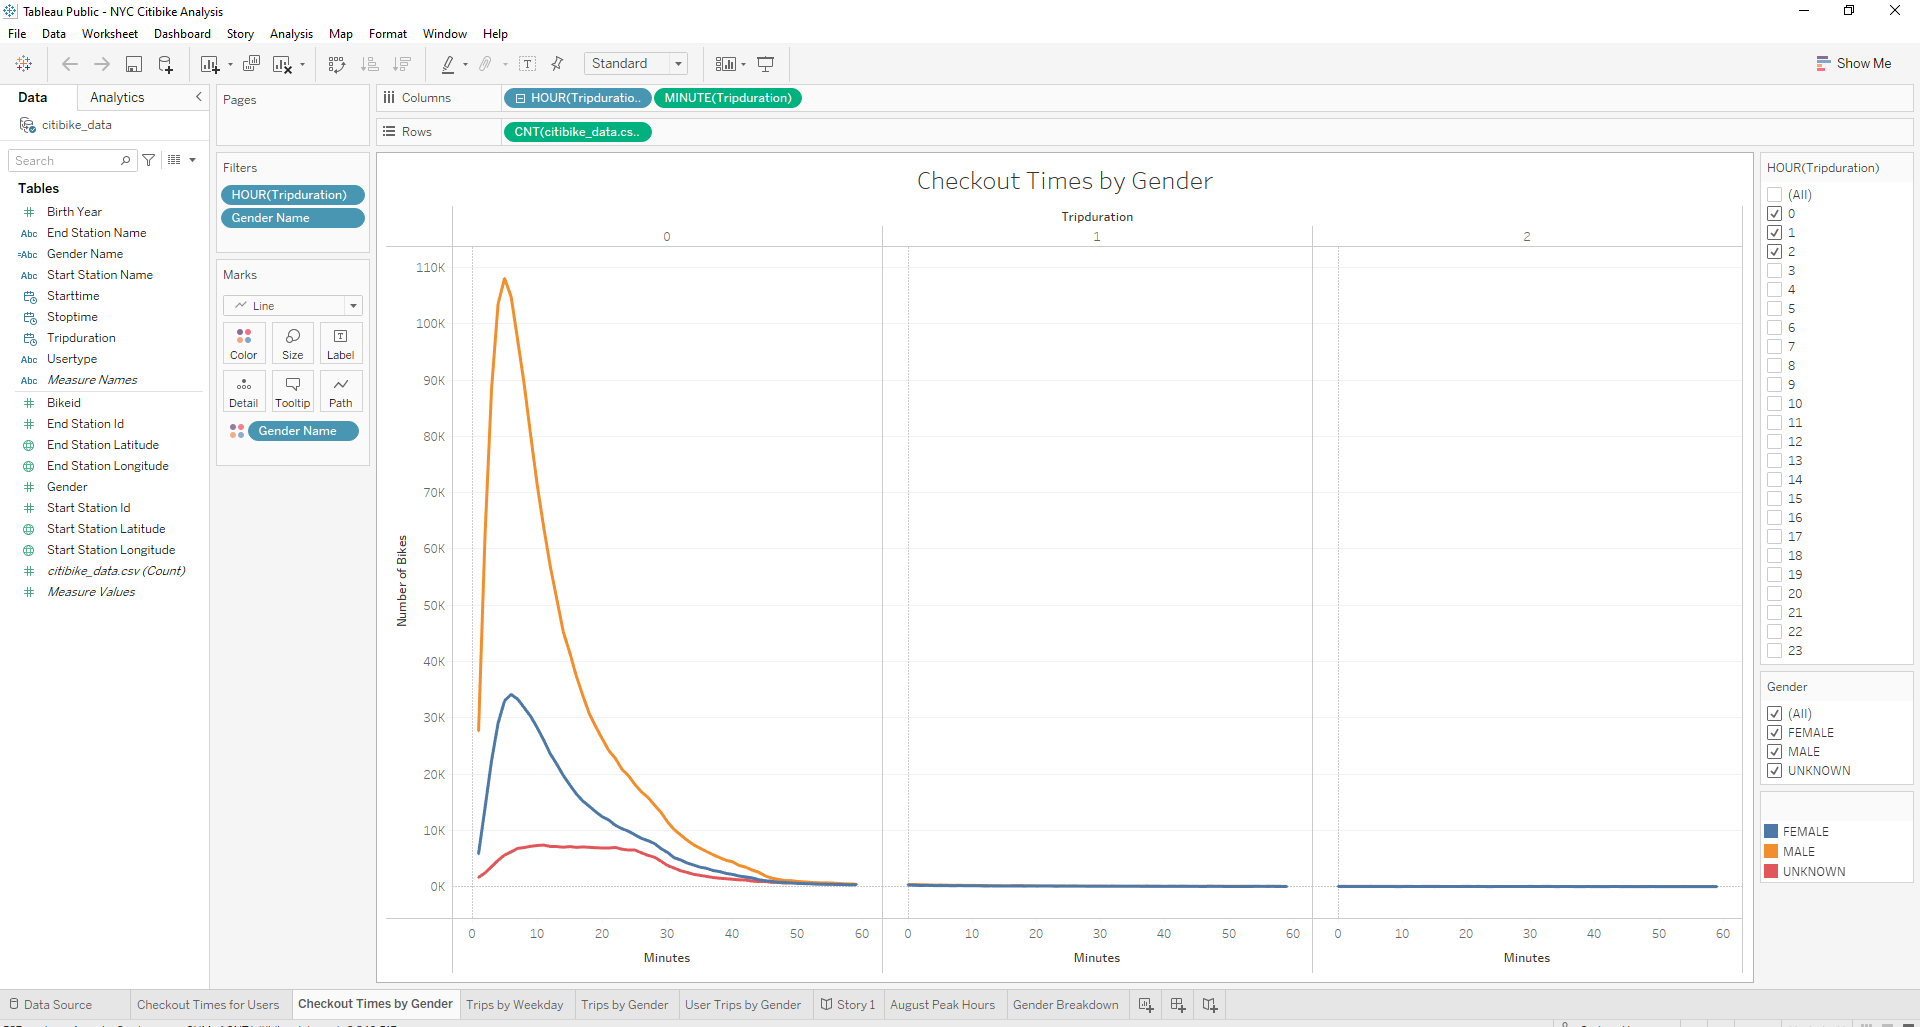
The following visualization displays user checkout times separated by gender, female, male or unknown. Males have the most checkouts in the upto 50 minute range, especially for checkout times for 5 minutes. Females have the second most checkouts, peaking at 6 minute checkout times. Unknown genders have the least checkouts in the first 60 minutes, with a similar number of checkouts in the 5 to 25 minute range. After 60 minutes Males, Females and Unknowns have a similar number of checkouts for longer checkout times.
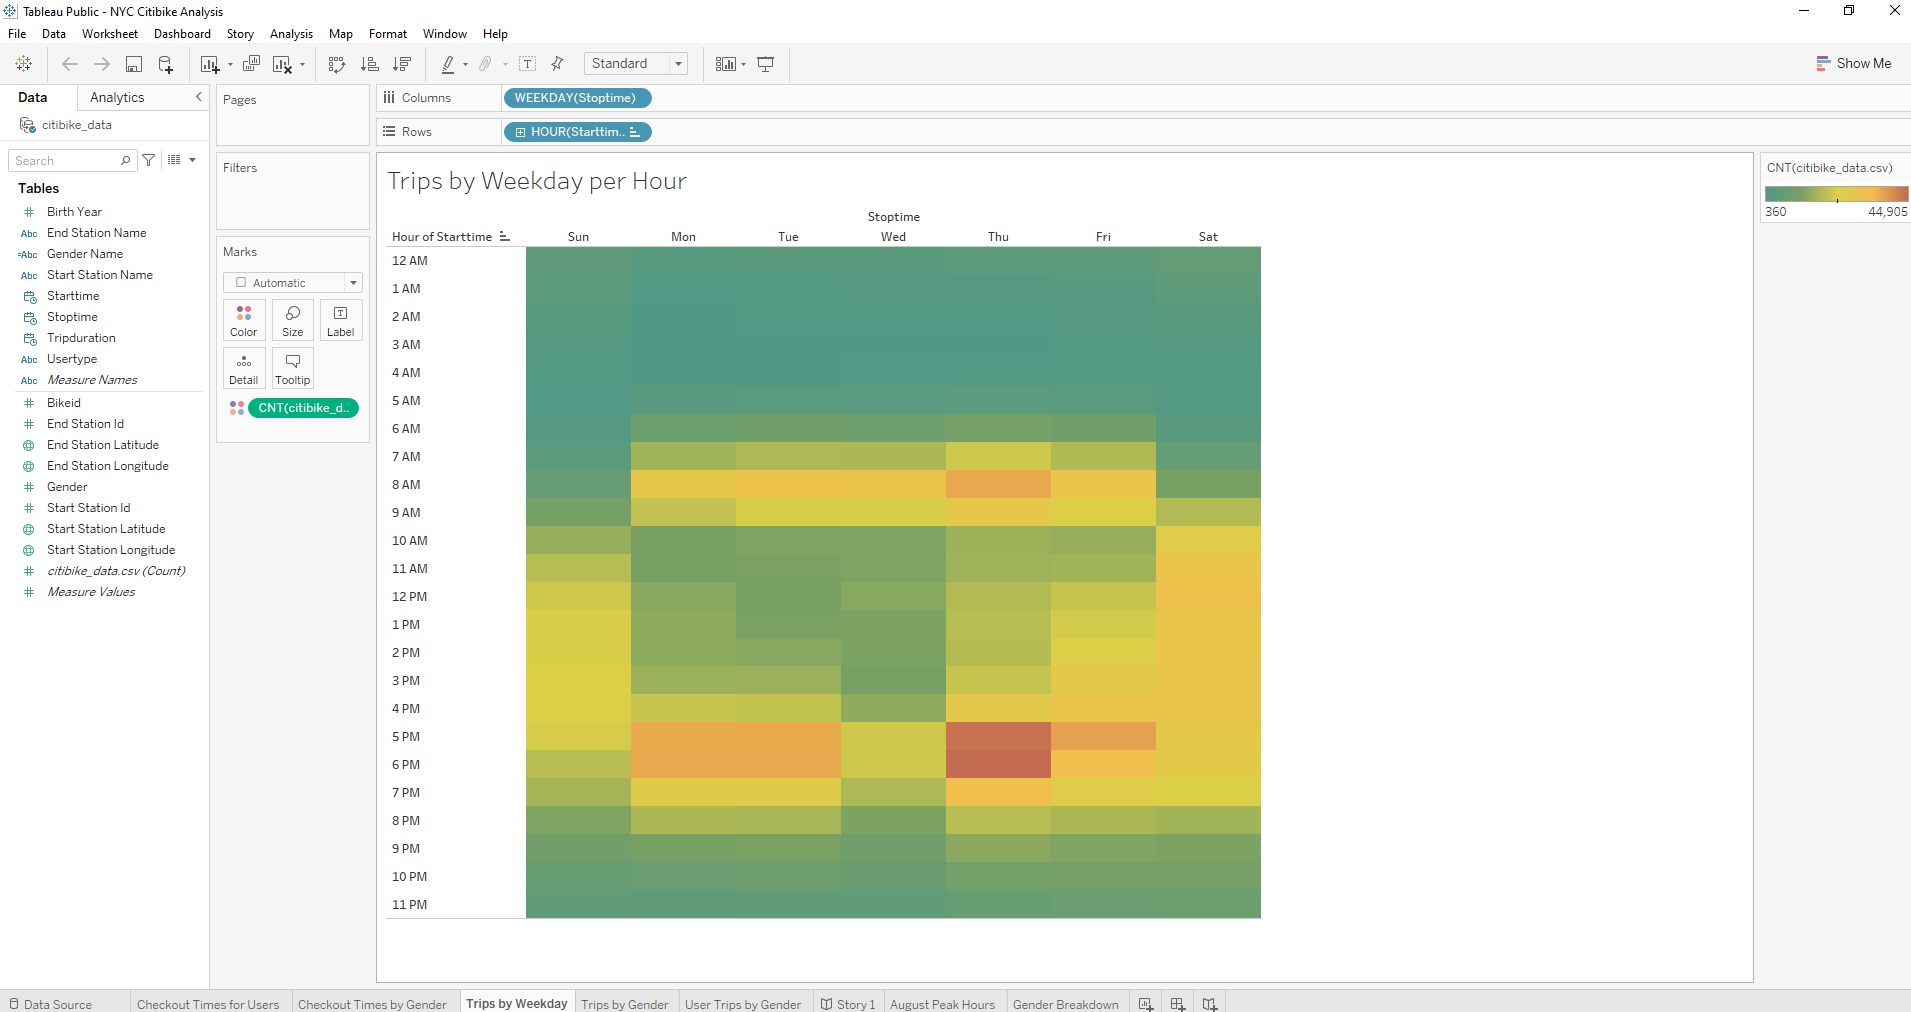
The heatmap below displays the number of bike trips by hour per weekday. Green represents fewer bike checkouts, and red the most bike checkouts. The maximum number of trips occur at 6pm on Thursday evenings. In general, the most bike checkouts occur M-F around 8am and between 5-7pm, and on Saturdays between 10am and 7pm. Wednesday and Sunday have fewer bike checkouts than other weekdays.
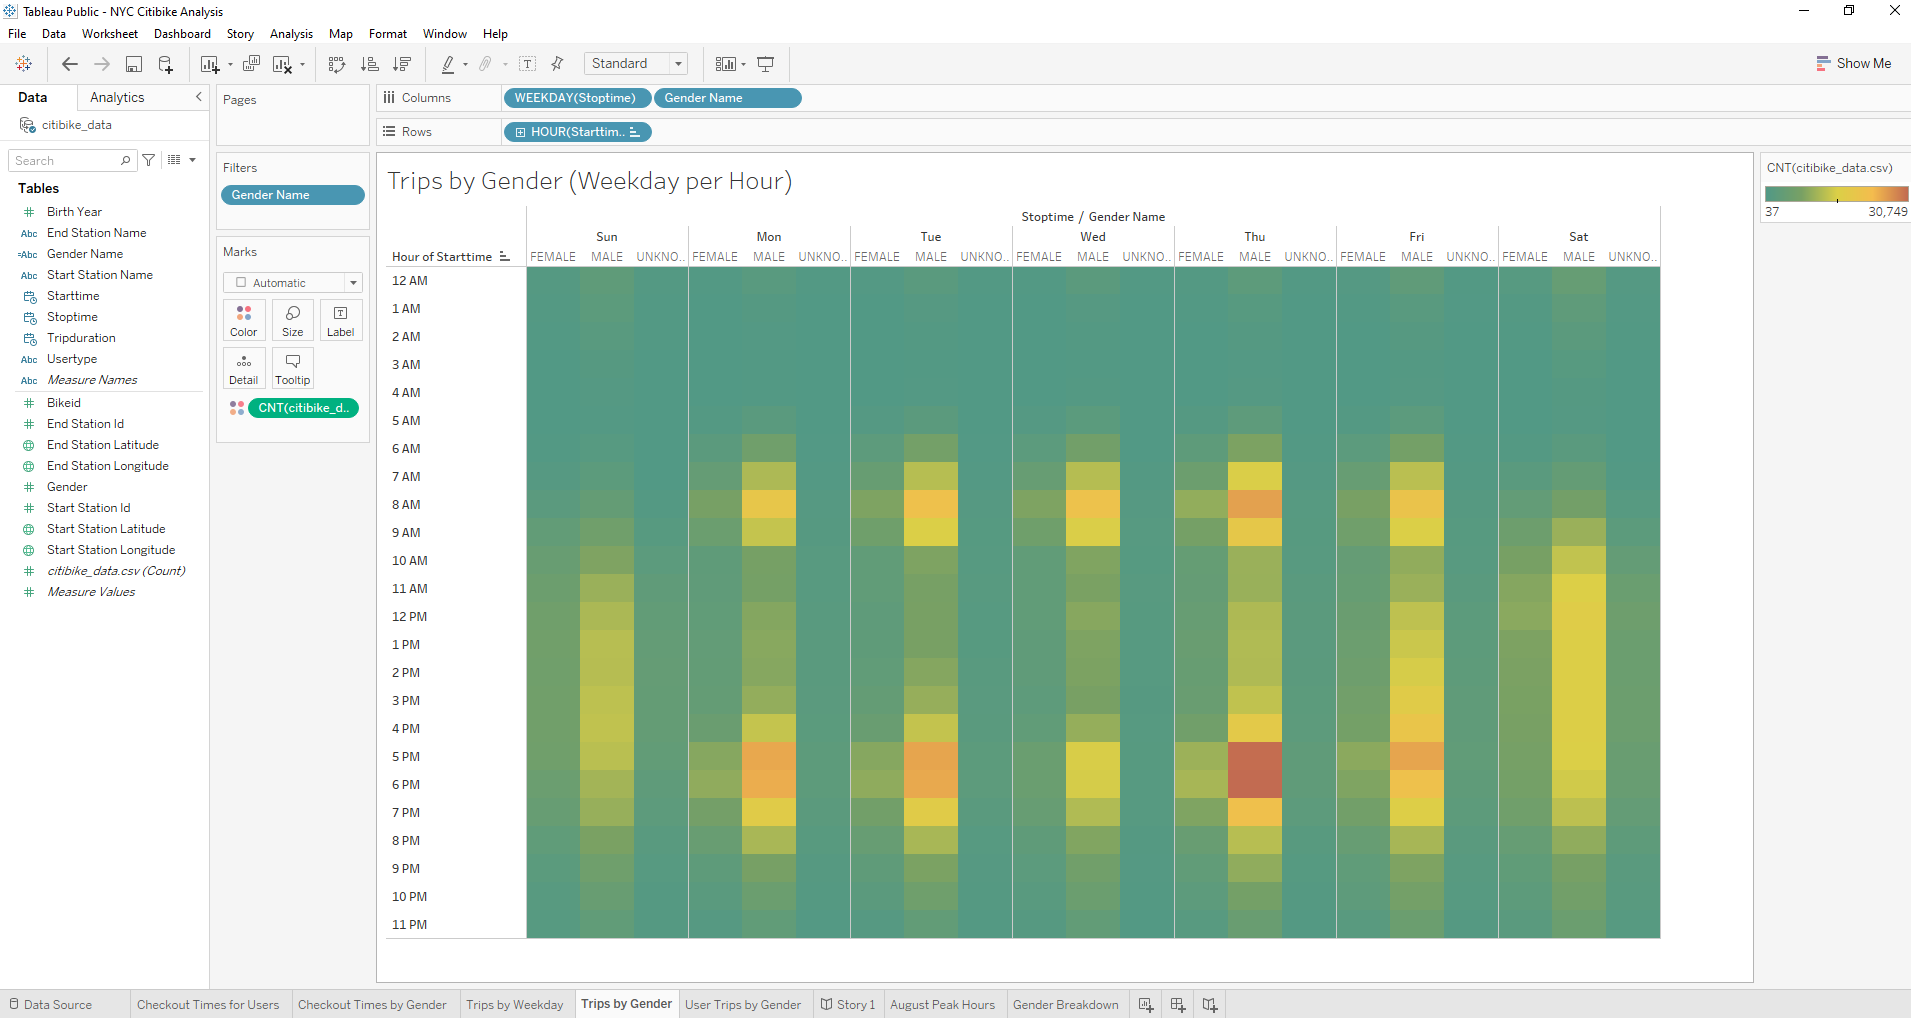
Male and Female trips per weekday are similar to trips by weekday per hour for all users. Unknown gender users have fewer bikecheckouts on weekday mornings and a similar number of bikecheckouts throughout the day M-F, unlike Male and Female users that have fewer checkouts during the midday and more at 8am and 5-7pm.
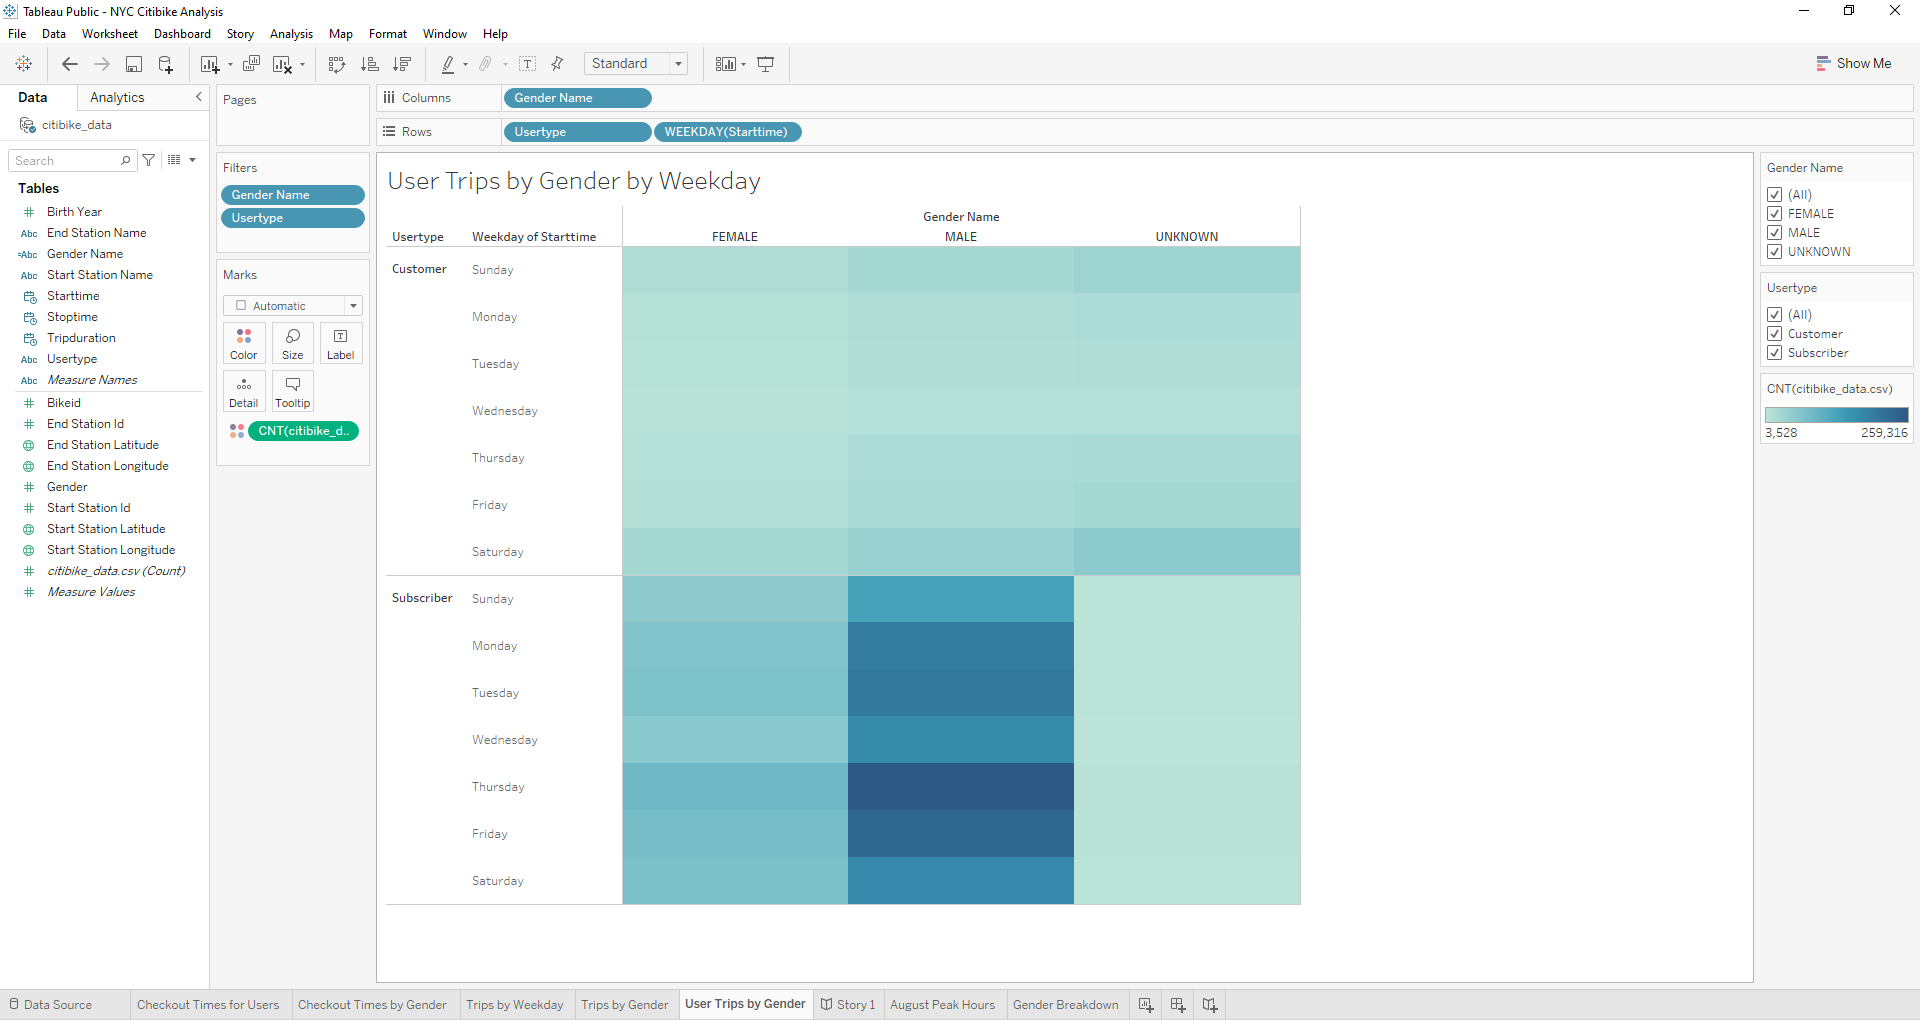
Unknown gender riders are the most prevalent single use costumers for bike checkouts during the week compared with male and female users. Male and female users are most likely subscribers. Males have the most subscribers on Thursday and the fewest on Sunday, Wednesday, and Saturday.
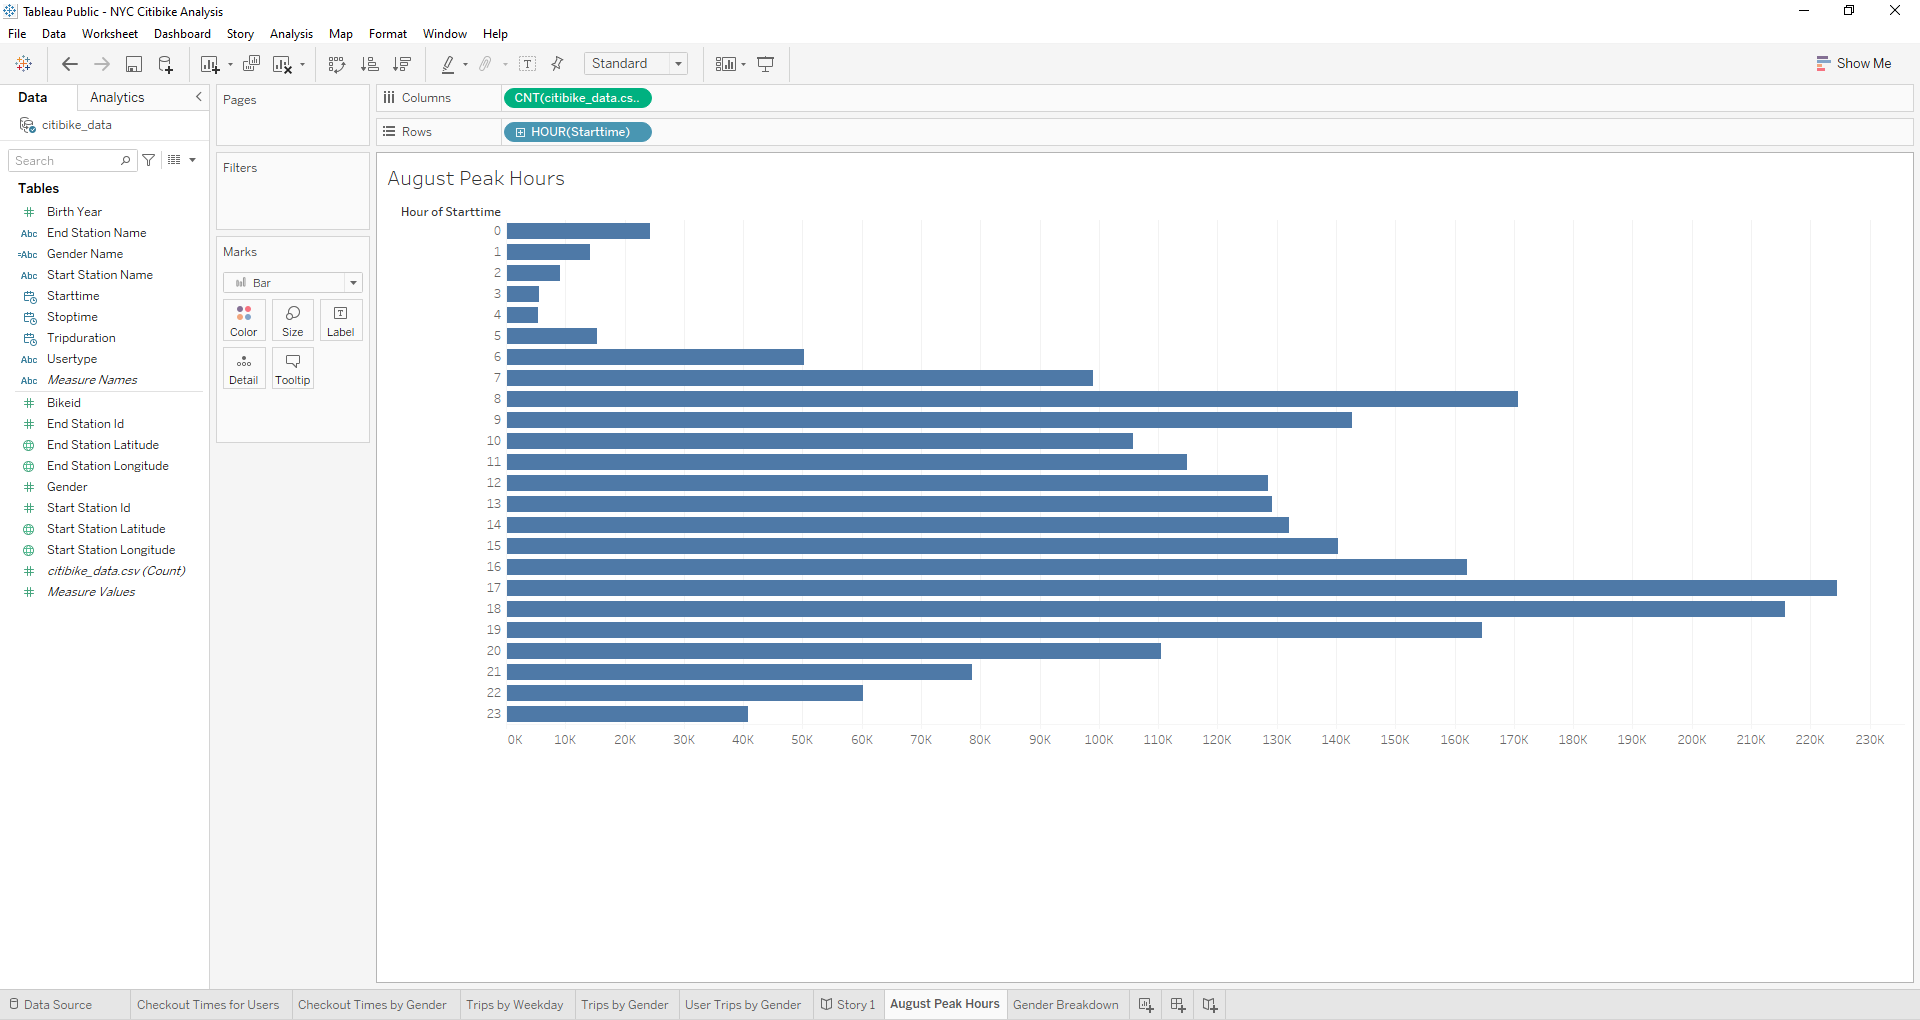
In August, the most bikecheckouts occur at 5pm, followed by 6pm and 7am.
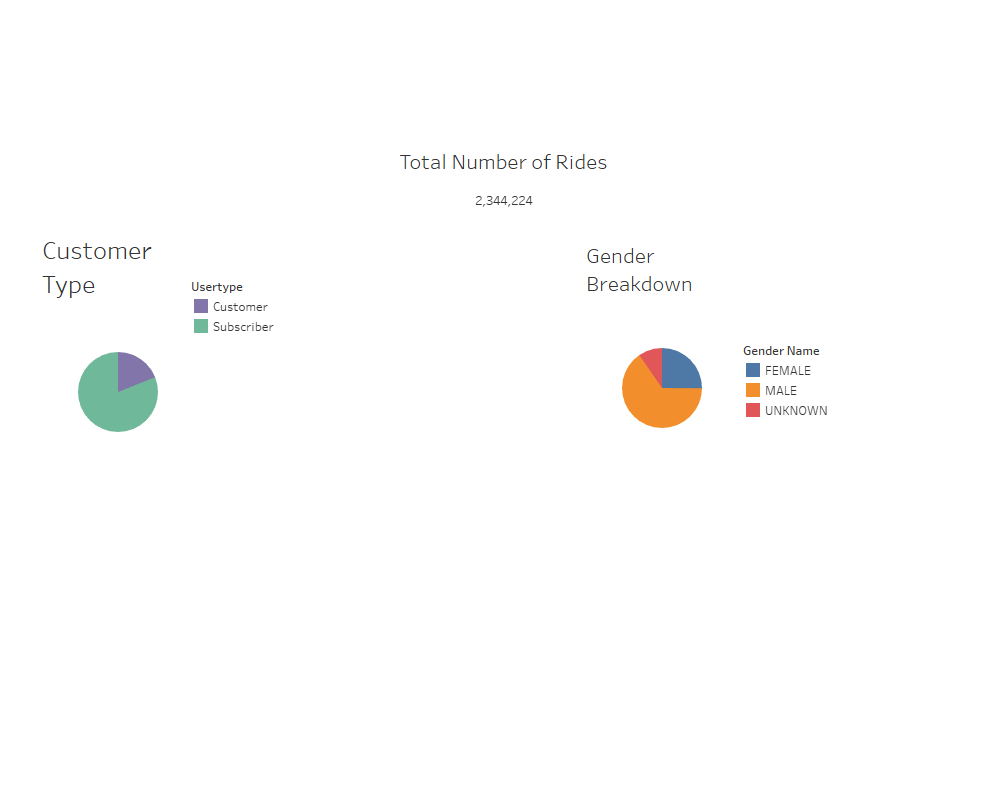
During the time period represented by the data file, Citibike had a total of 2,344,224 bike users. By customer type, about 81% of users were subscribers and 19% were single-use customers. By gender, about 65.3% of users were male, 25.1% of users were fenale, and 9.6% of users were of unknown gender.
Summary:
There was a total of 2,344,244 Citibike users in New York City during the month of August 2019. Of these, 81%(1,900,359) were subscribers and 19%(443,865) were single-use customers. By gender, about 65.3% of users were male, 25.1% of users were fenale, and 9.6% of users were of unknown gender. In general, the most bike checkouts occur M-F around 8am and between 5-7pm, and on Saturdays between 10am and 7pm. The maximum number of bike checkouts occur at 6pm on Thursday evenings. Wednesday and Sunday have fewer bike checkouts than other weekdays. Unknown gender riders are the most prevalent single use costumers for bike checkouts during the week compared with male and female users that tend to be subscribers. Males have the most checkouts by subscribers on Thursday and the fewest on Sunday, Wednesday, and Saturday. Citibikes are most often checked out for short durations, the most popular time period being 5 minutes for all user types. Male riders checkout the most bikes for short duration trips, followed by female users. Bike checkout times over 60 minutes in length have a similar number of checkouts between male, female, and unknown user types. In the future, an analysis showing the breakdown of customer-type(subcriber, or customer) by gender would provide more information on differences between customer types and could inform marketing campaigns. In addition, a tableau map showing bike checkout locations, filtered by customer type and weekday could show any differrences between popular bikestations for subscribers, customers or the differences in checkout locations by day of the week.