Open source metrics monitoring and alerting framework.
Scrapes text-based metrics over HTTP from remote agents.
Stores metrics in a local Time Series DB with querying capabilities.
- Key Points
- Setup
- HTTP API
- PromQL
- Comparisons
- Collections Agents
- Exporters
- Alert Manager
- Push Gateway
- PromLens
- Resources
- metrics + alerting by SoundCloud
- written in Go
- second project in the CNCF after Kubernetes
- standalone, no dependencies, only local disk
- 1 static binary -
prometheus - 1 config file -
prometheus.yml - pull based - HTTP
/metricsscraping - TSDB - time-series DB
- Queryable
- tag based metrics
- Push Gateway - port 9091 - for short lived jobs
- Exporters - agents serving HTTP
/metricsto be used as Scrape Targets by Prometheus server- lots of different exporters, see Exports section for list
- Scrape Targets:
- Static config or
- Service Discovery - discover targets to scrape dynamically:
- Generic - DNS, Consul, ZooKeeper
- VMs - AWS EC2, Azure, GCP, Openstack
- Cluster Managers - Kubernetes, Marathon (Mesos)
- No Auth or TLS - use Nginx / HTTPd / HAProxy in front for SSL + Authentication
- very efficient - unlikely to need sharding + federation until thousands of machines
- Scale - single server can handle:
- millions of metrics
- hundreds of thousands of data points per sec
- Federation - pulling metrics from other Prometheus servers:
- tree aggregates from other Prometheus
- set Prometheus as scrape targets
metrics_path: /federate match[]section
- High Availability - dual ingest to 2 identical servers + Load Balance
- AlertManager email / pager:
- discovery similar to target discovery
- groups clients so mass outage appears as 1 alert not hundreds / thousands
- inhibitions - suppress similar alerts
- PromQL query language:
- can make query predictions based on current rate, such as:
- how full will disks be in 4 hours
- can make query predictions based on current rate, such as:
- not suitable for billing as not detailed / complete enough
- backfill support on roadmap (OpenTSDB already has this)
- Recording Rules:
- like InfluxDB continuous queries
- compute new time series at regular intervals
- pre-materialise expensive queries for faster dashboards
- Alerting Rules - sends alerts
- similar config to Recording Rules
- based on expression results eg.
>= 1
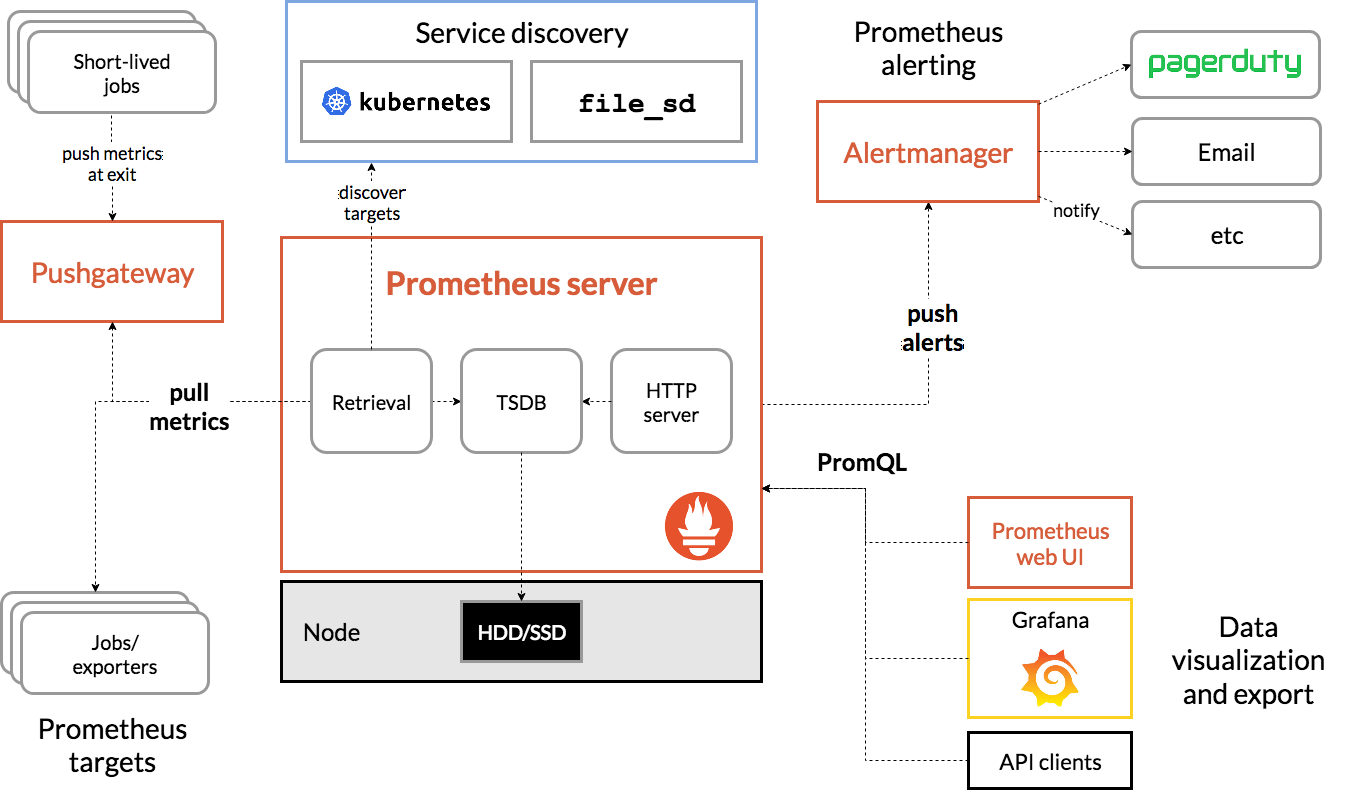
Key Summary:
- Multi-dimensional data model - stores metrics with labels (key-value pairs) for flexible querying
- PromQL (Prometheus Query Language) - powerful language used to query, aggregate, and display metrics
- Time-series storage - stores metrics as time-stamped values for historical analysis
- Visualization - integrates with tools like Grafana to create dashboards and visualize metrics
- Alerting - configurable alerts based on metric thresholds or conditions
- Service discovery - automatically discovers services and targets based on configurations
- Prometheus Server
- Scrapes and stores time-series data from configured targets (like services, applications, and systems)
- it also hosts a basic web UI for querying
- Exporters
- agents that gather metrics and present them as semi-structured text over HTTP on an non-standard port
- Client Libraries
- instrument your own apps to expose
/metricsin the Prometheus text format for Prometheus server to scrape
- instrument your own apps to expose
- Alertmanager
- handles alerts generated by Prometheus based on predefined conditions
- routes them to appropriate channels (email, Slack, etc.)
- Pushgateway
- metrics sink long-running server for short-lived jobs to push metrics to for Prometheus server to then scrape (since Prometheus server cannot scrape ephemeral short-lived jobs that come and go)
| Port | Description |
|---|---|
| 9090 | Prometheus |
| 9091 | Push Gateway |
| 9100 | Node Exporter |
| 9103 | Collectd exporter |
| 9273 | Telegraf exporter |
Prometheus has native Web UI on port 9090 with nice metric names autocomplete.
But Grafana is generally considered the gold standard of metric UI and integrates with most major open source metrics and time series databases like InfluxDB and OpenTSDB
PromLens is a web-based query builder for PromQL by PromLabs.
https://demo.promlabs.com/metrics
Scrapes metrics from HTTP /metrics endpoints called 'targets'.
Stored as:
- Timestamp - 64-bit int in ms
- Value - 64-bit float (in future will be histogram)
- Gauge: current measurement, can go up or down
- Counter: cumulative count over time
- usually need to wrap it in queries with a function like
rate()/irate()/increase()to be meaningful eg.rate(my_counter[5m])
- usually need to wrap it in queries with a function like
- Summaries: percentiles / quantiles
- do not aggregate across summaries - not statistically valid
- Histogram: bucketed stats, cumulative
For a gauge or counter that is process start time:
time() - process_start_time_secondsNo long term storage, but can forward to remote storage.
Remote Storage Adapters for:
- Graphite
- InfluxDB - write + read back
- OpenTSDB - write only (still use this for history graphs)
- forwarder listens on 9201
- Cortex - scalable long term storage for Prometheus
Configure remote_write to send to remote storage.
- Read back supported on some adapters eg. InfluxDB
- But no PromQL push down - all data must be read back and computed on Prometheus
- Inefficient / Poor Performance / Non-Scalable
Thanos - federates multiple Prometheus for scaling
Download and install Prometheus binary and any Exporters you want to run.
You can download and extract the Prometheus tarball manually from Downloads page
or just run the scripts from DevOps-Bash-tools repo
to install the latest GitHub release to your $PATH (/usr/local/bin or $HOME/bin):
install_prometheus.shDownload starter config from HariSekhon/Templates repo:
wget https://raw.githubusercontent.com/HariSekhon/Templates/refs/heads/master/prometheus.ymlRun prometheus:
prometheusCreates $PWD/data/ directory full of data.
Defaults worth noting:
--config.file='prometheus.yml'
--storage.tsdb.path='data/'
--storage.tsdb.retention='15d'Manually run:
docker run -ti -p 9090:9090 prom/prometheusUsing Docker-Compose tooling:
HariSekhon/DevOps-Bash-tools - docker-compose/prometheus.yml
docker-compose -f prometheus.yml upFully scripted using above docker-compose/prometheus.yml in DevOps-Bash-tools repo:
HariSekhon/DevOps-Bash-tools - kubernetes/prometheus.sh
prometheus.shList the targets and check they have UP in the State column that they are being correctly scraped.
http://localhost:9090/targets?search=
Enter a metric name to query:
prometheus_tsdb_head_samples_appended_total
Switch from Table to Graph view tab.
Since this metric only goes up, calculate its rate of ingestion instead by changing the query to this:
rate(prometheus_tsdb_head_samples_appended_total[1m])
Graph the 90th percentile of request durations for the demo scrape target in last 5 mins split by URL /paths:
histogram_quantile(0.9, sum by(le, path) (rate(demo_api_request_duration_seconds_bucket[5m])) )
/api/v1/query?query="..."
https://promlabs.com/promql-cheat-sheet/
mymetric{tag1="value1", tag2!="value2", tag3=~match3, tag4!~match4}[interval]
http_requests_total{kubernetes_namespace="dev", _weave_service="podinfo"}))
sum(http_requests_total) by (kubernetes_namespace, _weave_service)
Interval must be at least as big as collection period otherwise will get no results for say 10s if collection interval is 1m (default, set to 30s for prod).
rate(http_requests_total[1m])
Find per second:
sum(rate(http_requests_total{_weave_service="podinfo"}[1m])) / 60
Ratio of unsuccessful requests - put this in to a Prometheus alert > 50
sum(rate(http_requests_total{_weave_service="podinfo",status!="200"}[1m])) / sum(rate(http_requests_total{_weave_service="podinfo"}[1m]))
sum(rate(http_requests_total{kubernetes_namespace="dev", _weave_service="podinfo"}[1m]))
Alerts
ALERT errorRate
IF sum(rate(http_requests_total{_weave_service="podinfo",status!="200"}[1m])) / sum(rate(http_requests_total{_weave_service="podinfo"}[1m])) > 0.5
FOR 1m
LABELS      { severity="critical" }
ANNOTATIONS {
  summary = "error rate > 50%",
  impact = "bad",
  detail = "blah"
}
| Prometheus | Graphite |
|---|---|
| proactive (scraping, alerting, rule processing) | passive Time Series db |
| irregular timeseries | fixed interval |
| label name{key1=val1,key2=val2} | name.key.key2 |
| better for filtering via labels | has clustering |
| arbitrary precision | more complicated setup |
| Whisper-like RRD overwrites old data | Uses Whisper |
| Prometheus | InfluxDB |
|---|---|
| active, scrape, alert | passive Time Series db |
| metadata for ts stored once | stored for every event => 11x storage |
| indexes all columns | only indexes row timestamp (0.9 targeted for cols) |
| better for cumulative (downsampling feature) | better for storing individual events |
| single server (must shard manually or Thanos) | clustering (proprietary) |
| float only | int, float, bool, string |
| ms only | s, ms, microsecs, nanosecs |
| mem + 5 min flushes = data loss | durable (WAL) |
| Prometheus | OpenTSDB |
|---|---|
| active, scrape, alert | passive Time Series db |
| full query language | lacks full query language |
| PromQL more complex querying possible | only simple aggregations via API |
| doesn't scale, must Thanos | scales much better using HBase for horizontal scaling and sharding |
Static binary - exposes port 9100 /metrics for scraping.
Collectd & Telegraf have Prometheus plugins that listen for /metrics scraping requests.
Systemd integration gives stats on processes:
./node_exporter --collector.systemd- Collectd port 9103
/metrics - Telegraf port 9273
/metrics - Docker 1.13+ port 4999
/metrics- set docker daemon flags:
- daemon.json:
{ "metrics_addr": "0.0.0.0:9323", "experimental": true }
or --experimental=true --metrics-addr=0.0.0.0:4999
- daemon.json:
- set docker daemon flags:
Download exporters from the Prometheus Downloads page.
Or quickly install the binaries for these exporters using the install/install_prometheus_*.sh scripts in the
DevOps-Bash-tools repo.
Prometheus Node Exporter is a popular way to collect system level metrics from operating systems, such as:
- CPU
- Disk
- Network
- Process stats
install_node_exporter.shRun --help to see its options:
node_exporter --helpnode_exporterListens on port 9100.
See  prometheus/node_exporter GitHub homepage above for the list of different stats to enable / disable.
Import the ready-made dashboard for Node Exporter dashboard into Grafana.
Endpoint monitoring for uptime and availability metrics by probing of endpoints over HTTP(S), DNS, TCP, ICMP and gRPC.
install_prometheus_blackbox_exporter.shTODO: revision control configuration
install_prometheus_consul_exporter.shinstall_prometheus_graphite_exporter.shinstall_prometheus_memcached_exporter.shinstall_prometheus_mysqld_exporter.shinstall_prometheus_statsd_exporter.shKube State metrics is a service that talks to the Kubernetes API server to get all the details about all the API objects like deployments, pods, daemonsets, Statefulsets, etc.
Confluent Cloud Exporter - exports metrics from Confluent Cloud Metric API on port 2122
https://argo-cd.readthedocs.io/en/stable/operator-manual/metrics/
Capture the lag for each consumer offsets on different environments and alert when lag is more than 100.
https://pypi.org/project/airflow-exporter/
The Alert Manager handles alerts sent by client applications such as the Prometheus server.
It takes care of deduplicating, grouping, and routing them to the correct receiver integration such as email, PagerDuty, or OpsGenie. It also takes care of silencing and inhibition of alerts.
Alert Manager can be run in HA mode to ensure alerts are not missed.
install_prometheus_alertmanager.shinstall_prometheus_push_gateway.shWeb-based query builder for PromQL.
Quickly install the binary using DevOps-Bash-tools:
install_promlens.shRun --help to see its options:
promlens --helphttps://www.youtube.com/@PromLabs/videos
https://training.promlabs.com/
Ported from private Knowledge Base page 2016+