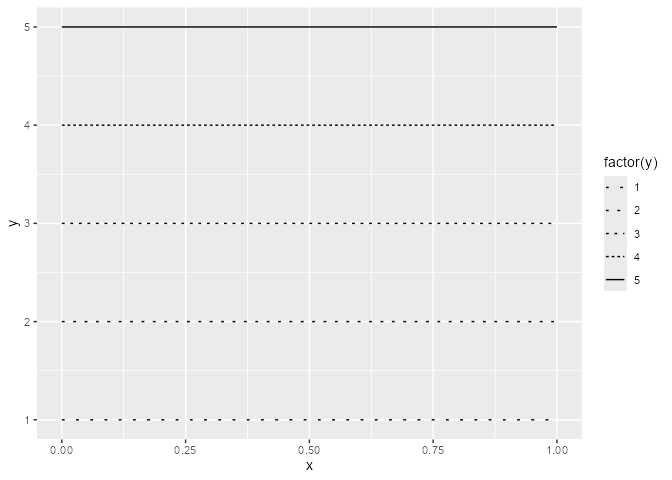
Idea blatantly stolen from elsewhere, but you can kinda encode a continuous variable by how dense your dashes and gaps are. I'm not saying this is great datavis, but there are worse chart crimes.
library(ggplot2)
#> Warning: package 'ggplot2' was built under R version 4.5.2

ggplot(data.frame(x = 0, xend = 1, y = 1:5)) +
  geom_segment(aes(x = x, xend = xend, y = y, linetype = factor(y))) +
  scale_linetype_manual(
    values = c("28", "26", "24", "22", "solid")
  )
Created on 2026-02-17 with reprex v2.1.1
Idea blatantly stolen from elsewhere, but you can kinda encode a continuous variable by how dense your dashes and gaps are. I'm not saying this is great datavis, but there are worse chart crimes.
Created on 2026-02-17 with reprex v2.1.1