SynBioSuite Tutorial Design
Tutorial author: Hatem Abdelrahman
BME PhD Student, University of Colorado Boulder
IWBDA 2026
- Introduction to the sc2 subcircuit of the MD5-hashing genetic circuit
- Getting started with SBOLCanvas
- Modelling the sc2 subcircuit on SBOLCanvas
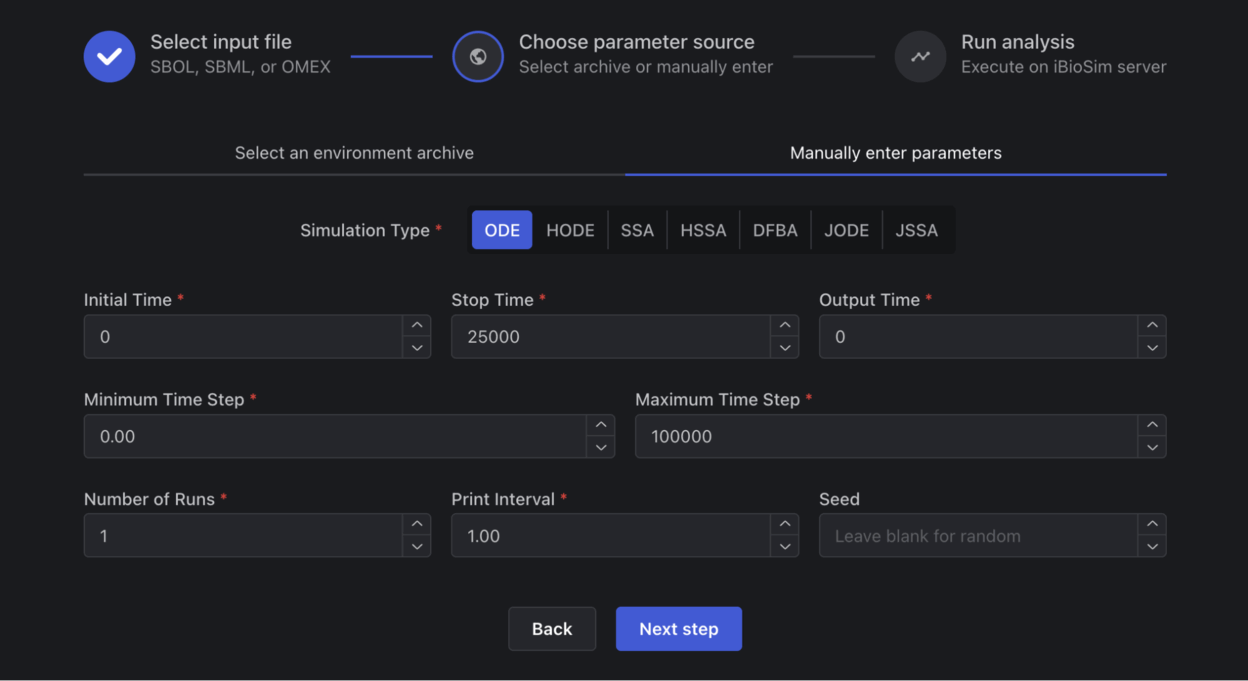
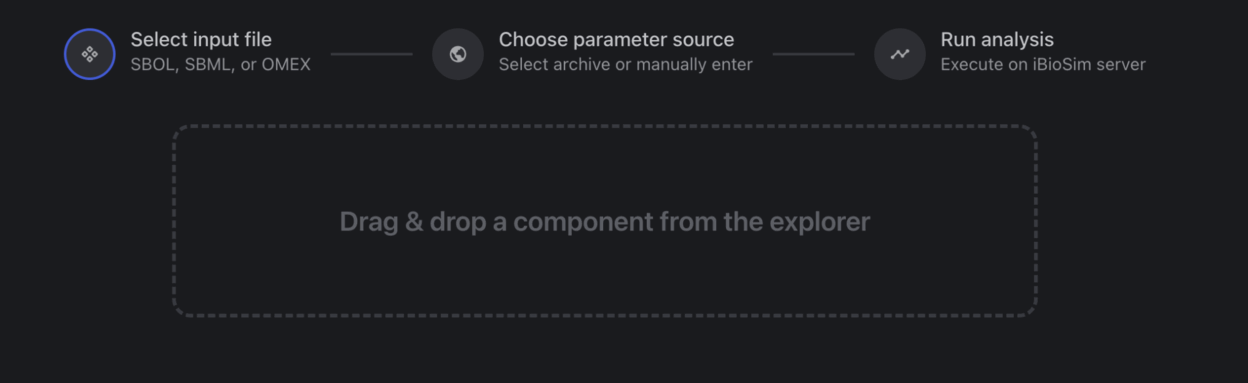
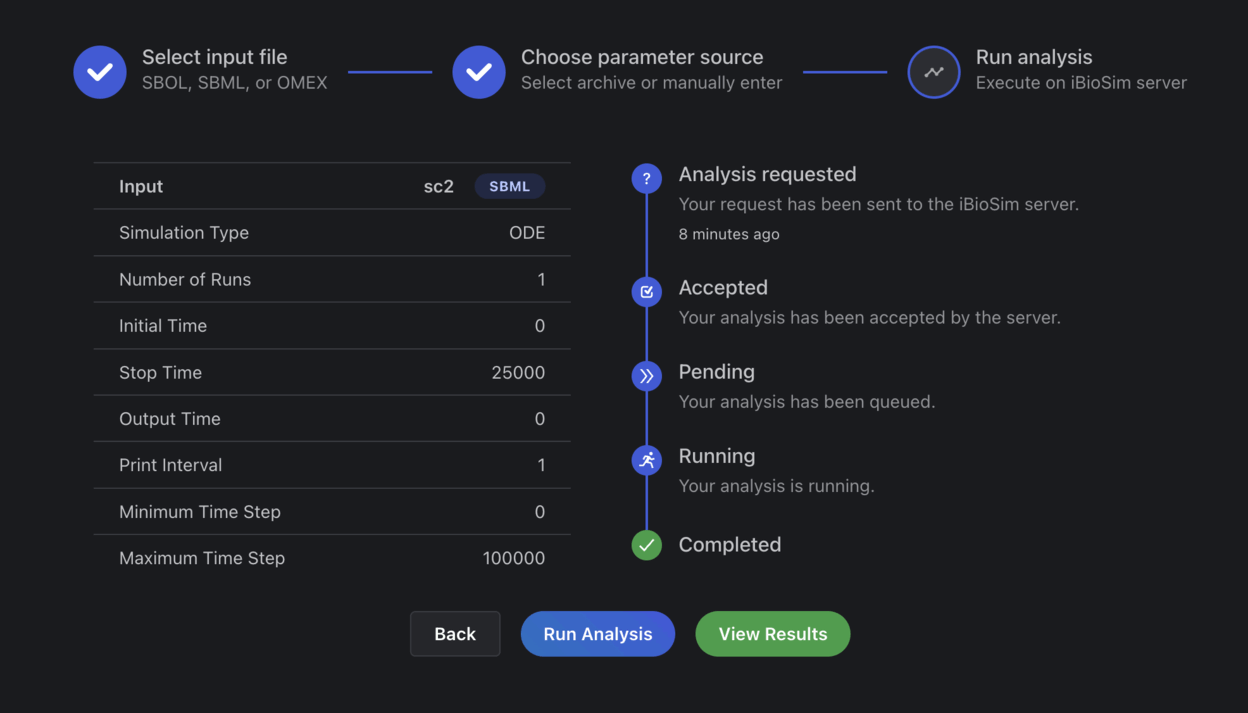
- Simulating circuit behavior on SynBioSuite Model Analysis (iBioSim backend)
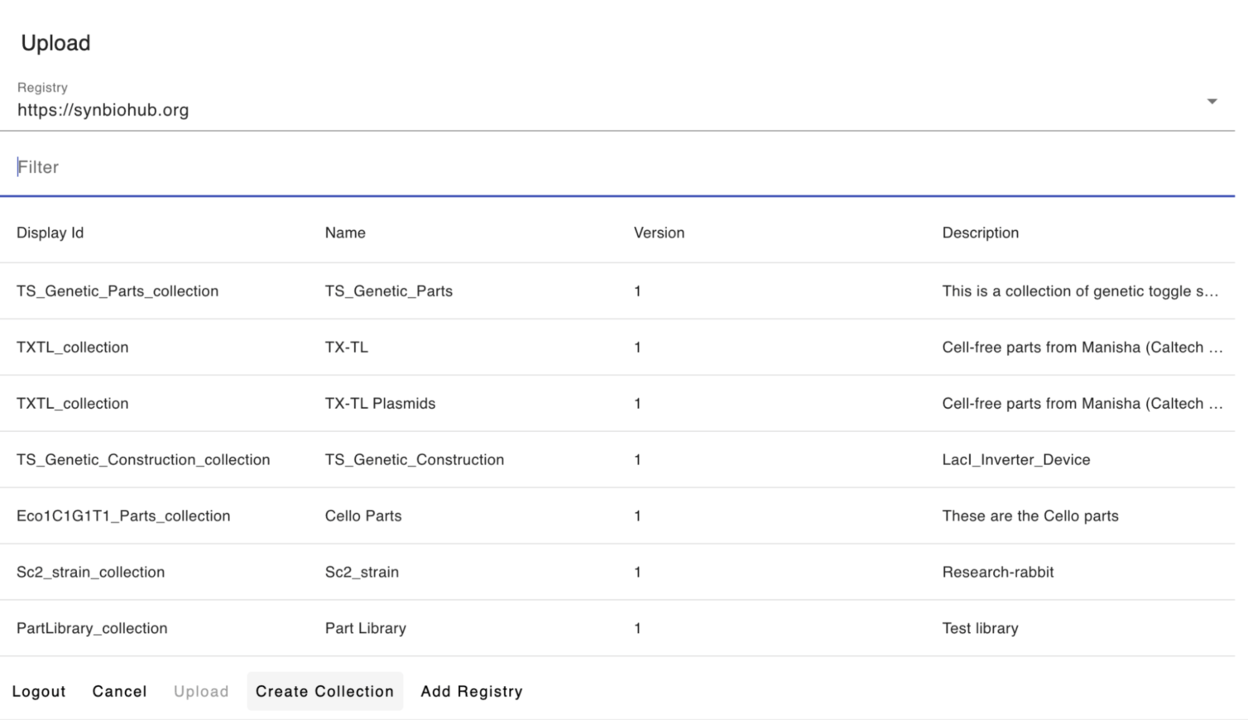
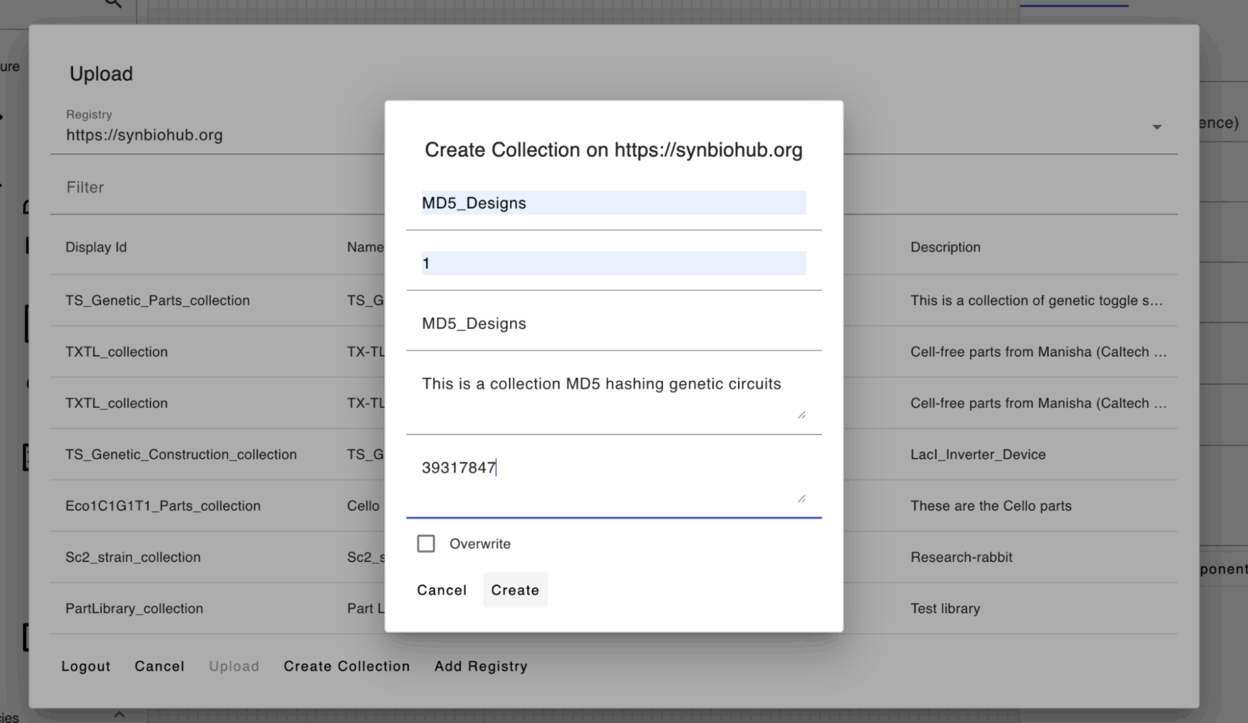
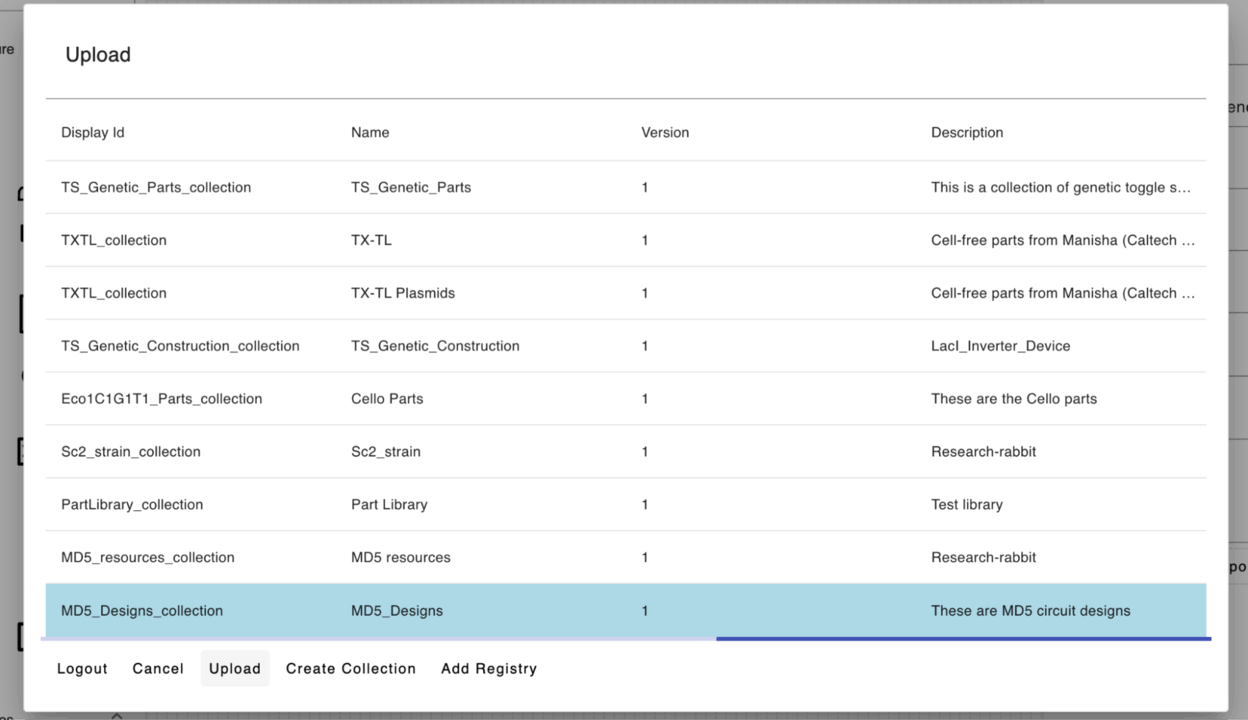
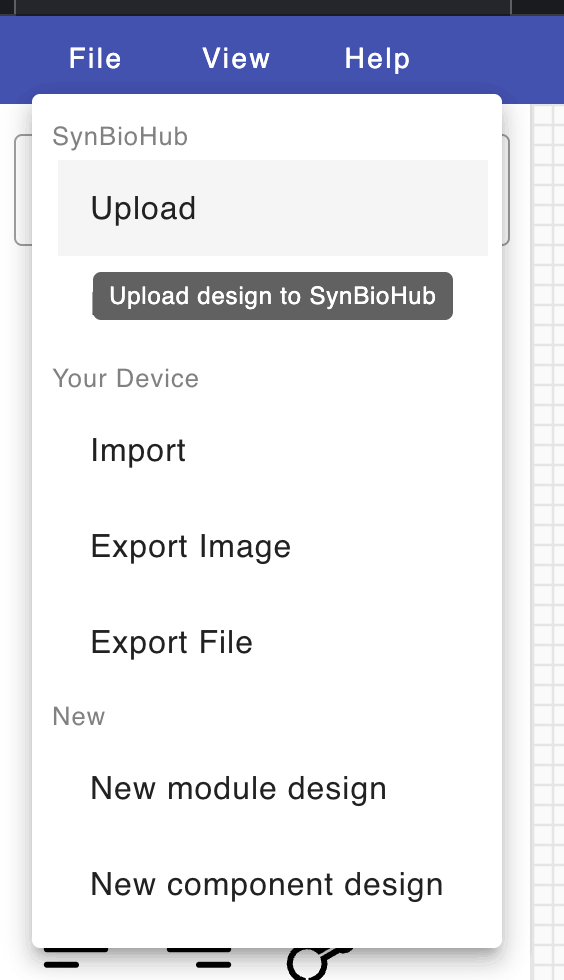
- Uploading sc2 circuit design to SynBioHub
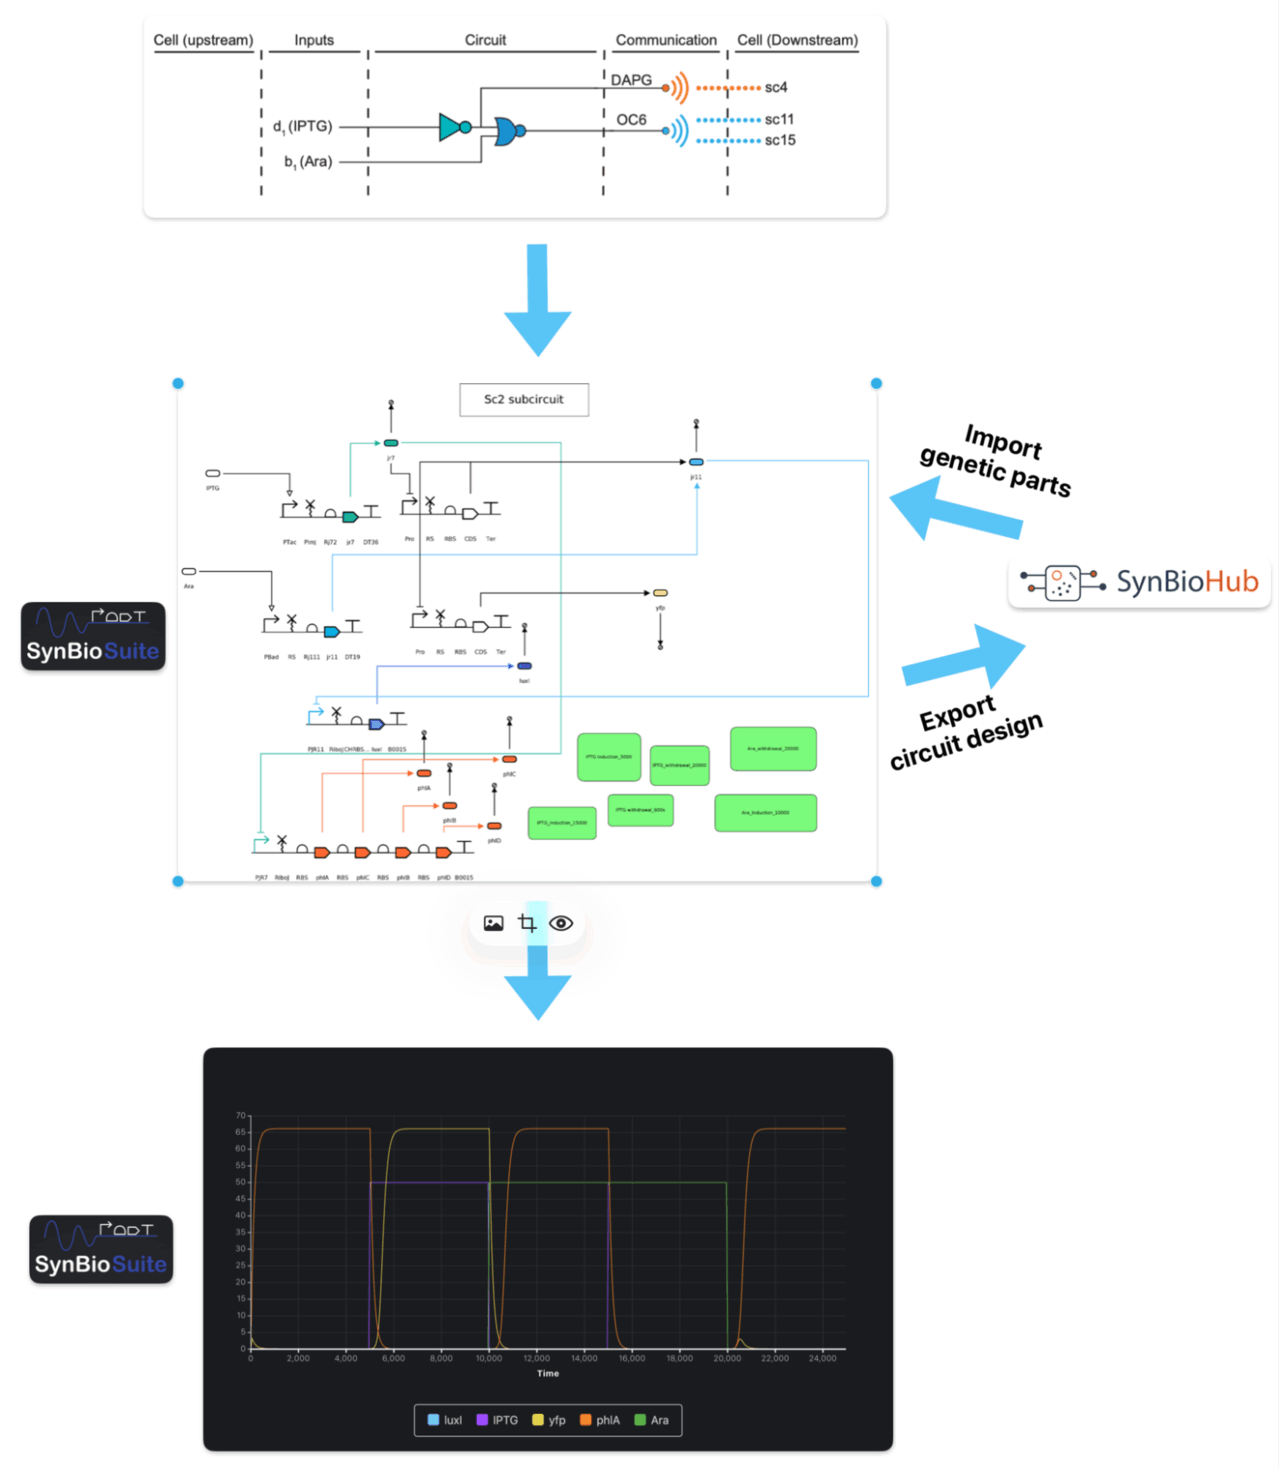
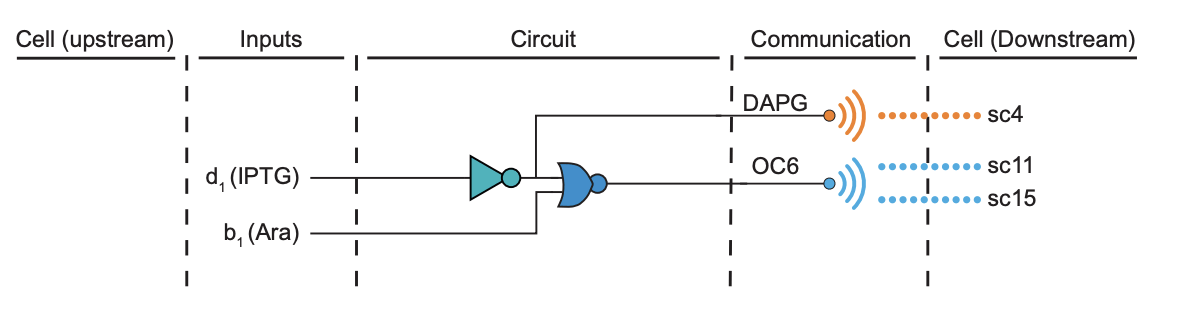
In this tutorial, we will learn how to model and simulate a combinatorial genetic logic circuit consisting of a NOT gate and a NOR gate connected in series such that the NOT gate inverts one of the inputs of the two-input NOR gate.
This circuit takes two chemical inducers (IPTG and Ara) as circuit inputs, performs boolean logic operations using transcriptional repressors and their cognate promoters, and then produces two small diffusible molecules (DAPG and OC6) as circuit outputs. OC6 is the output of the NOR gate while DAPG is the output of the NOT gate and is also one of the inputs of the NOR gate.
This circuit, also called sc2 subcircuit, is part of a larger multicellular genetic logic circuit created by Voigt's lab at MIT using the CelloCAD tool, which genetically implements a 2-bit version of the MD5 hashing algorithm using 110 NOT and NOR gates partitioned across 66 communicating Escherichia coli cells [1].
[1] Padmakumar, J.P., Sun, J.J., Cho, W. et al. Partitioning of a 2-bit hash function across 66 communicating cells. Nat Chem Biol 21, 268–279 (2025). https://doi.org/10.1038/s41589-024-01730-1
| NOT Gate | NOR gate |
|---|---|
 |
 |
 |
 |
 |
 |
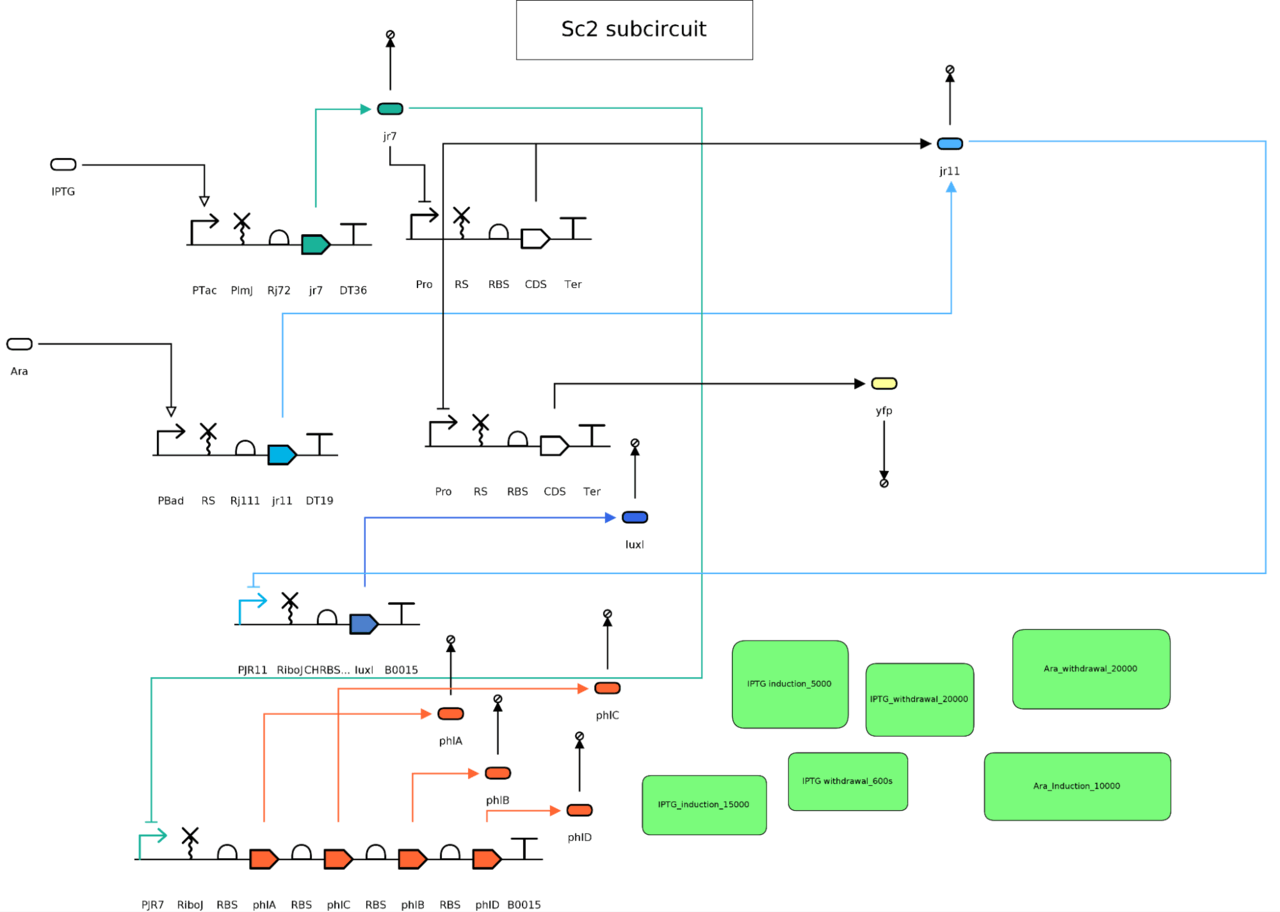
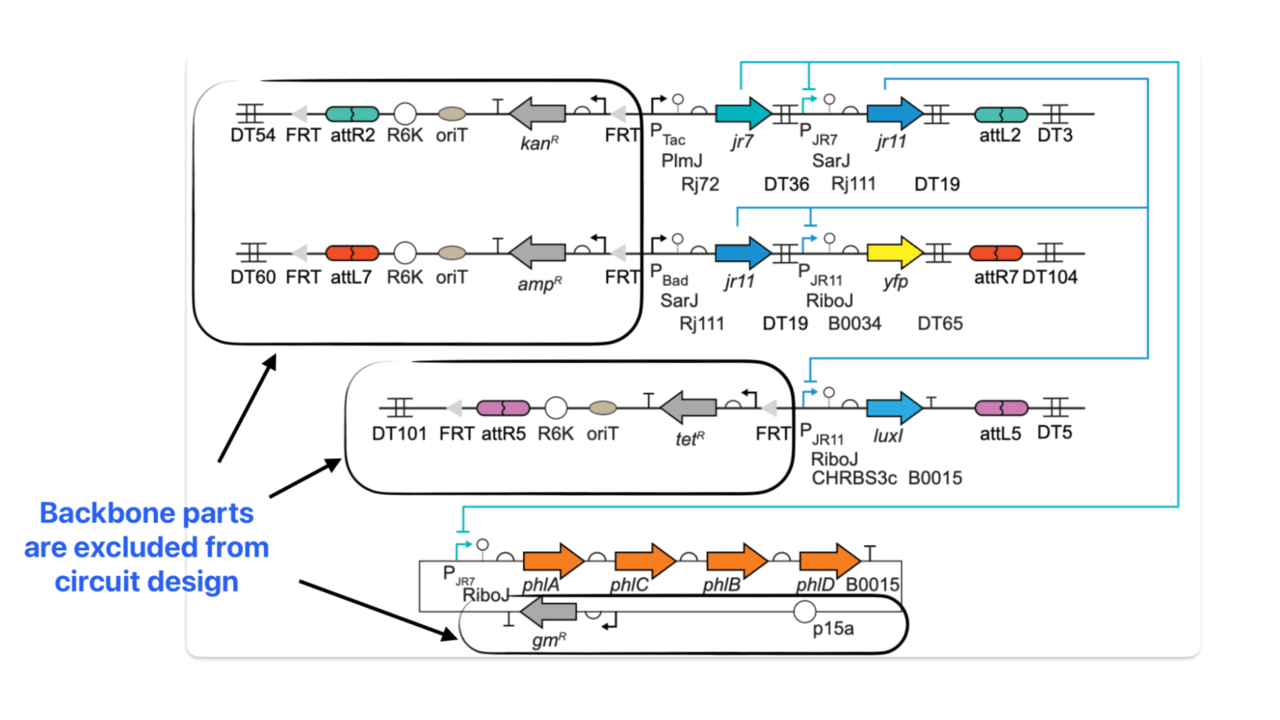
- Promoters: pTac, pBAD, pJR7, and pJR11
- Ribonuclease sites (ribozyme insulators): PlmJ, SarJ, and RiboJ
- Ribosome binding sites: Rj72, Rj111, B0034, and CHRBS3c
- CDSs:
- Transcriptional repressors: LacI, AraC, jr7 and jr11
- Fluorescent reporter: yfp
- Output biosynthesis enzymes: luxI, phlA, phlC, phlB, phlD
- Terminators: DT36, D19, DT65, and B0015
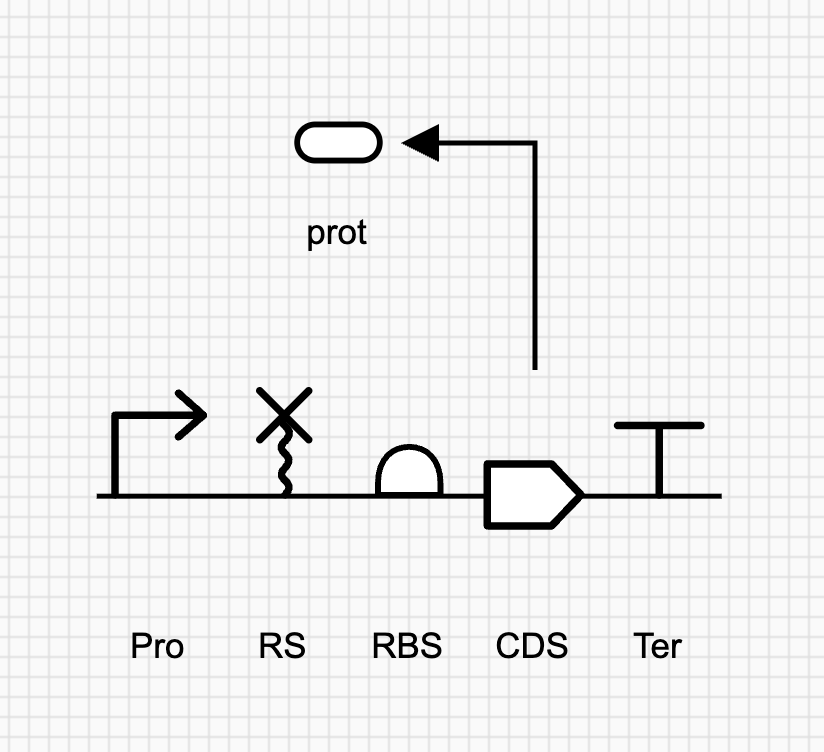
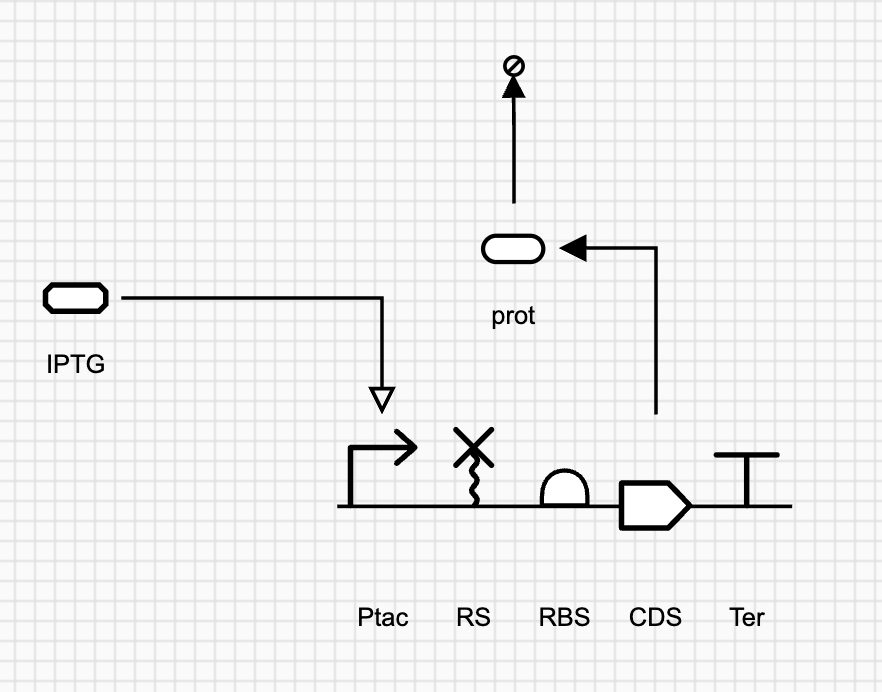
pTac and pBAD are the input inducible promoters that fire only in the presence of IPTG and Ara inducers, respectively. LuxI is an autoinducer synthase enzyme responsible for synthesizing the output signaling molecule: OC6 (N-(3-oxohexanoyl)-L-homoserine lactone) while the enzymes phlA, phlC, phlB, phlD are responsible for synthesizing the other output molecule: 2,4-diacetylphloroglucinol (2,4-DAPG).
Please note that the rest of the parts shown in the diagram belong to the backbone and will not be used to create the sc2 subcircuit as they do not participate in circuit interactions. Please also note that LacI and AraC are not explicitly shown in the diagram above. However, as we will learn later in this tutorial, they should be explicitly represented during circuit modelling on SBOLCanvas. More precisely, we will represent their complexes with the input inducers (IPTG-LacI and Ara-AraC).
Quick notes before we start the tutorial to avoid any issues:
- Please use Google Chrome browser for this tutorial (Safari/Firefox are not supported)
- Create a folder on your computer for the circuit design and name it "sc2"
Let's get started!
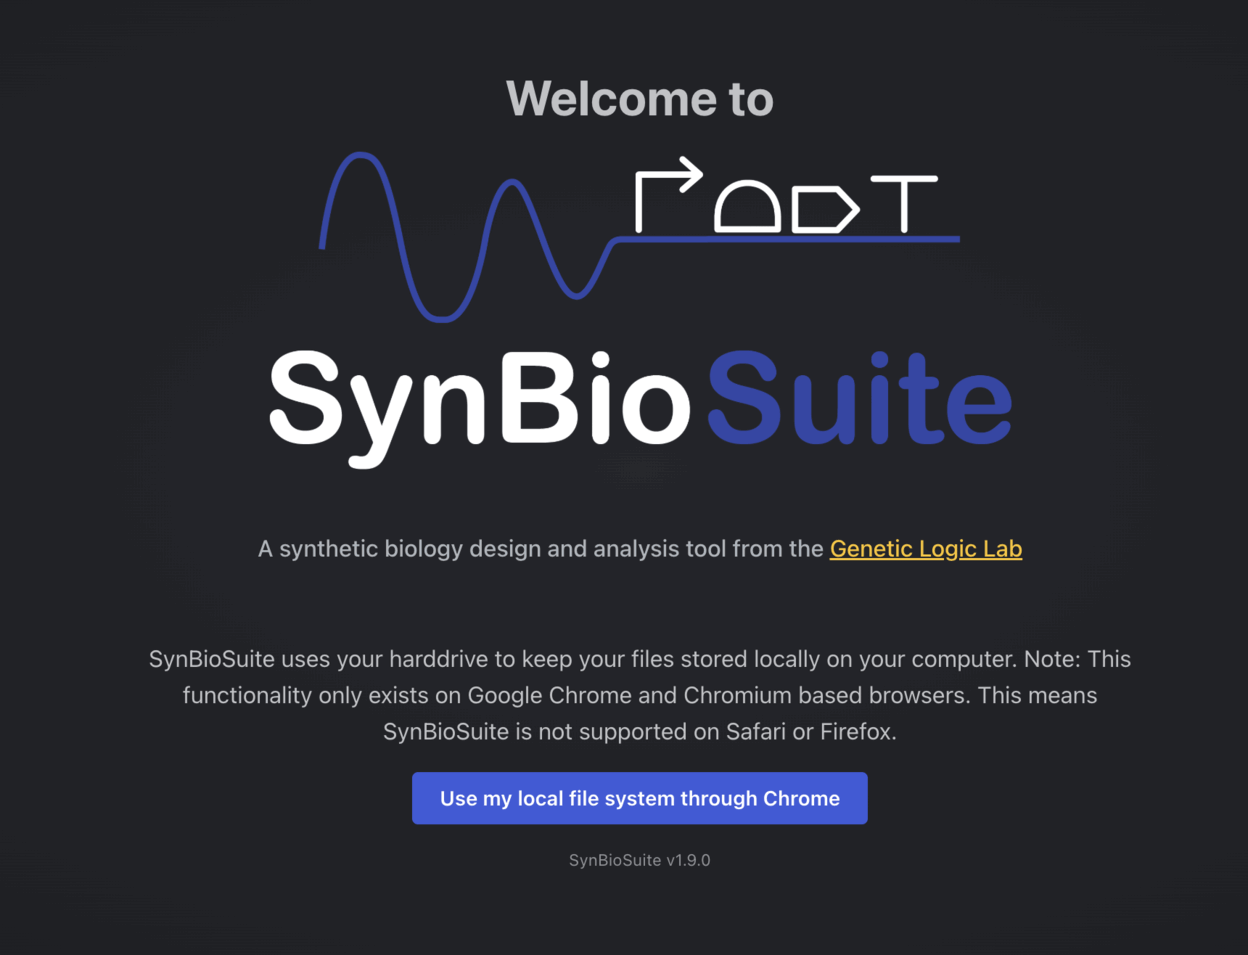
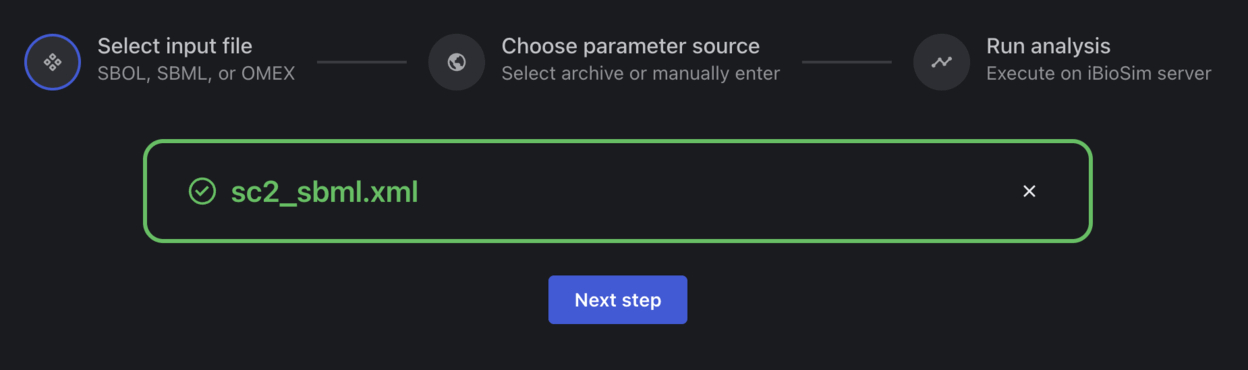
- Go to https://synbiosuite.org/ and click on "Use my local file system through Chrome".
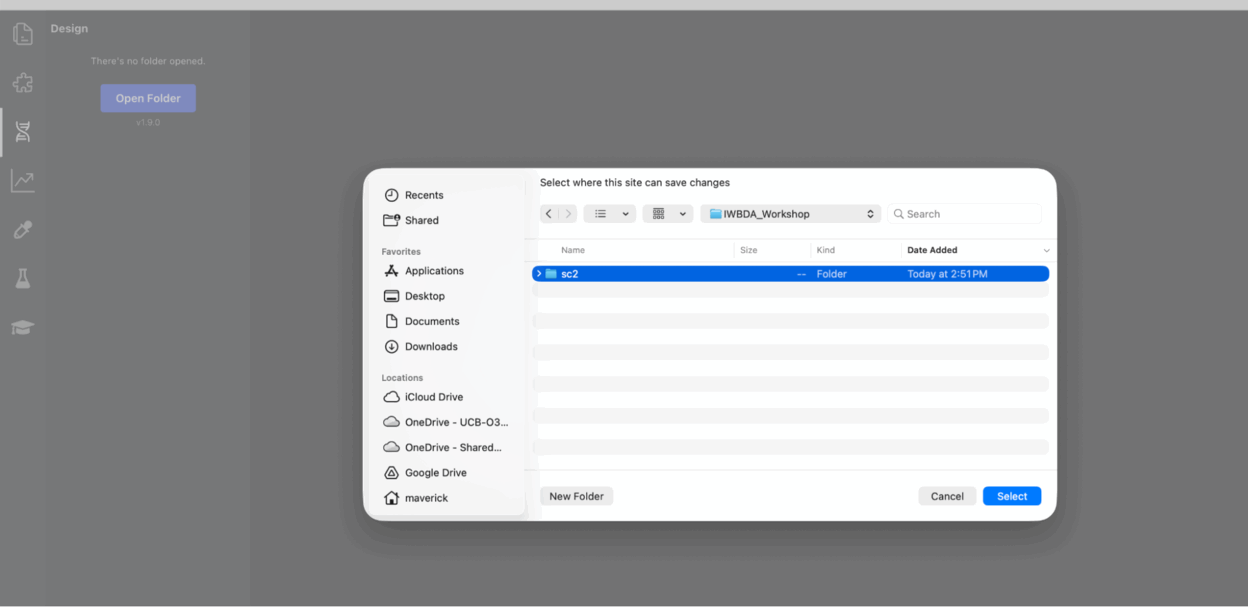
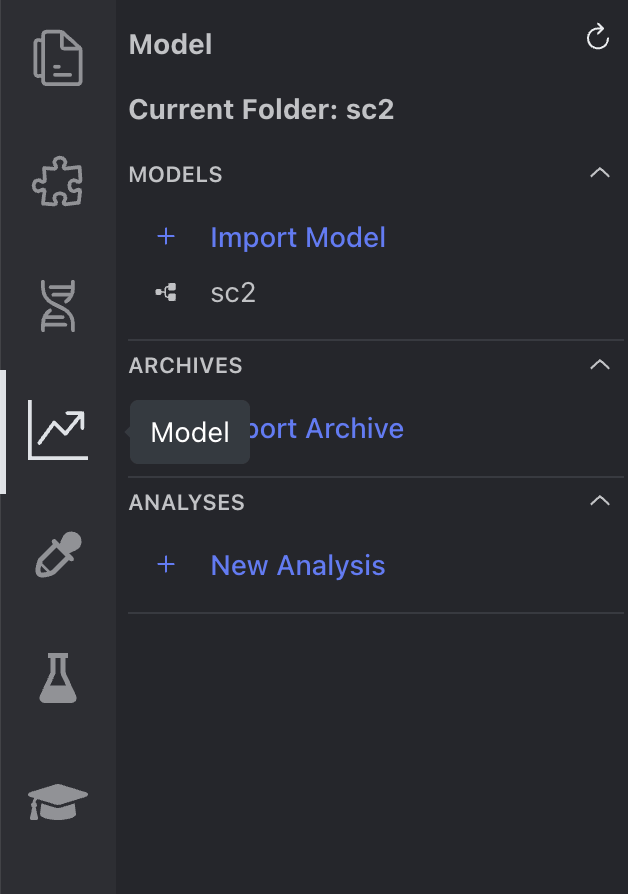
- Go to the "Design" tab on the side toolbar and click "Open Folder"
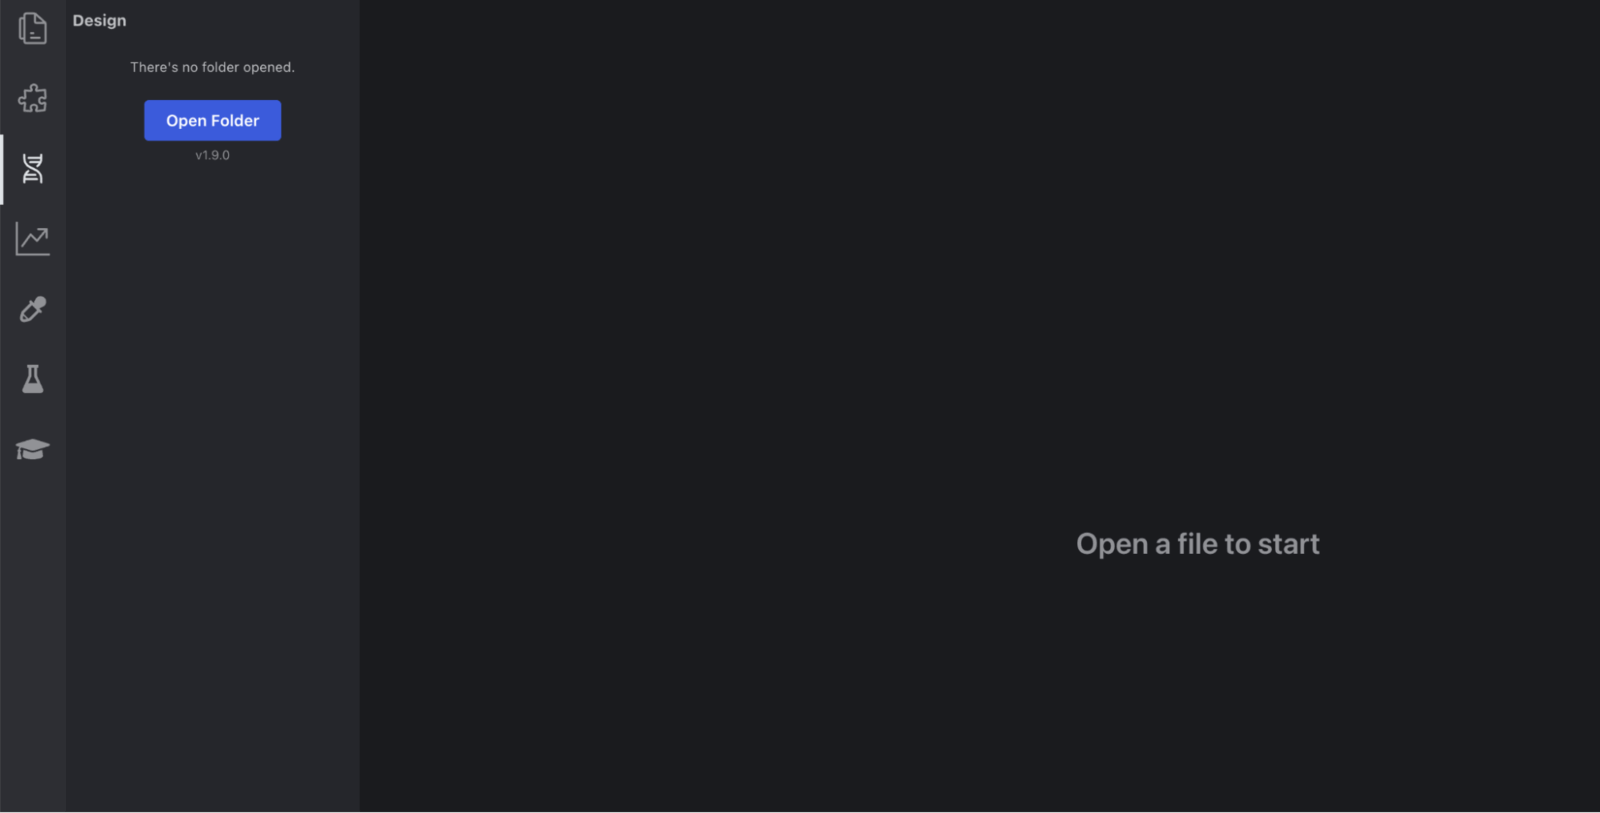
And select the folder you created earlier: "sc2"
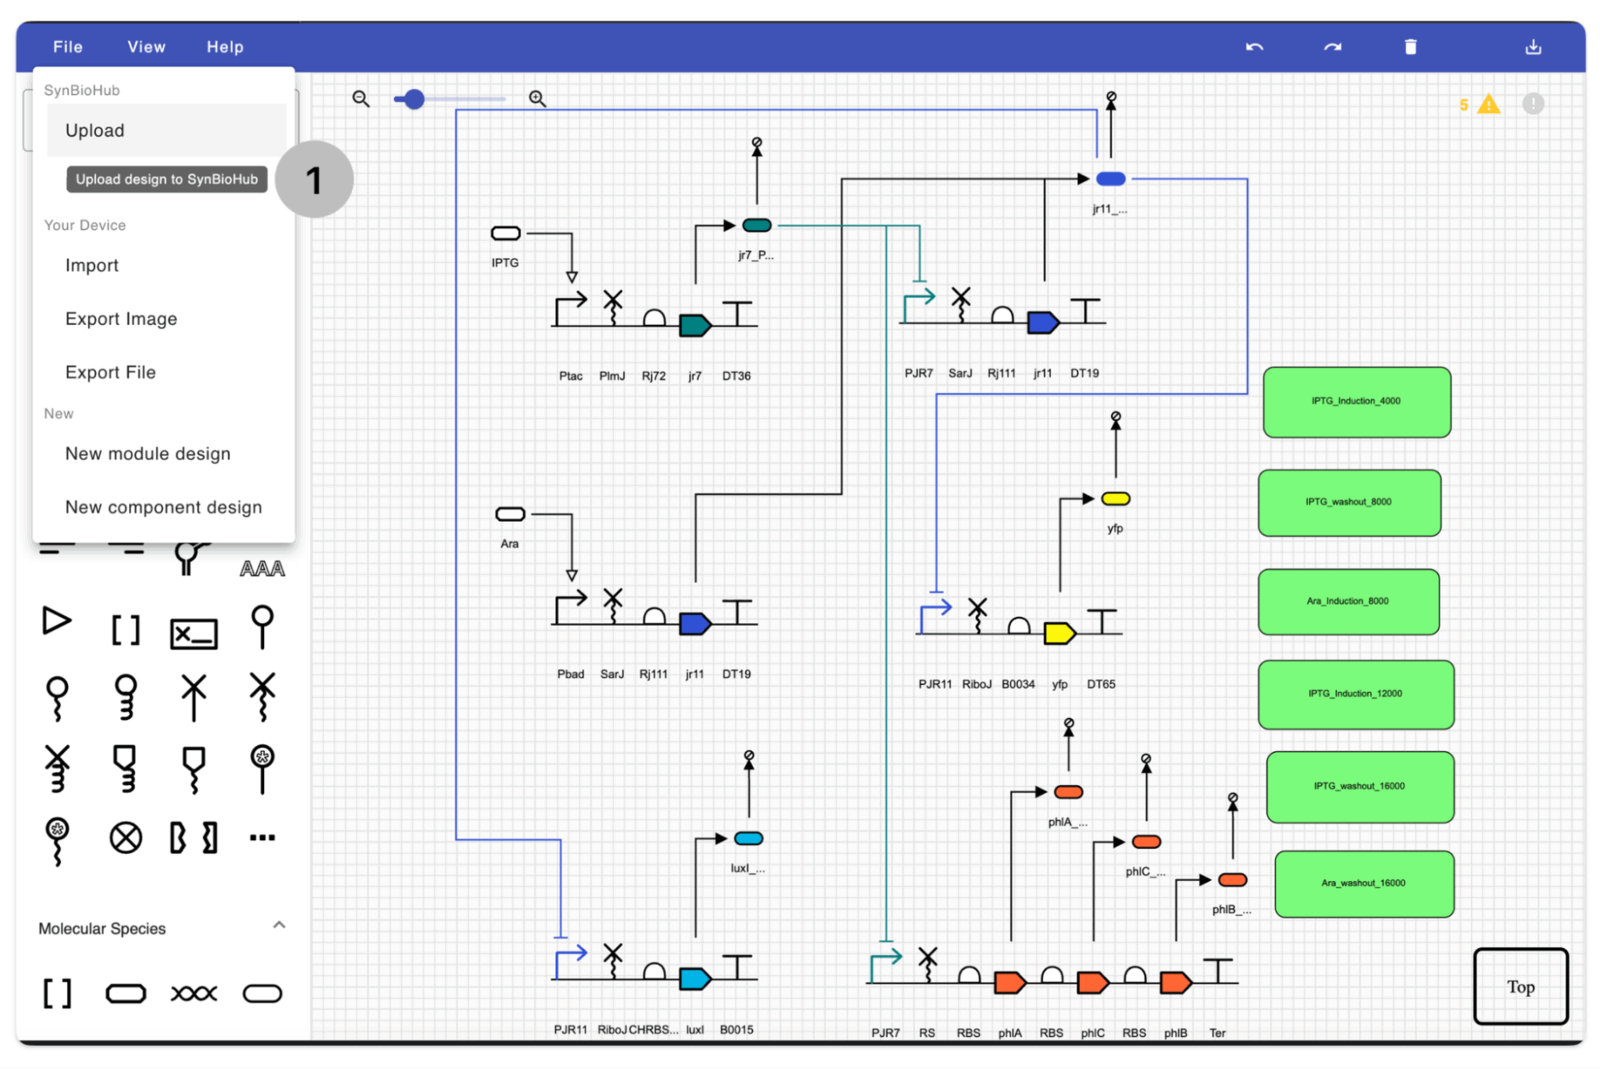
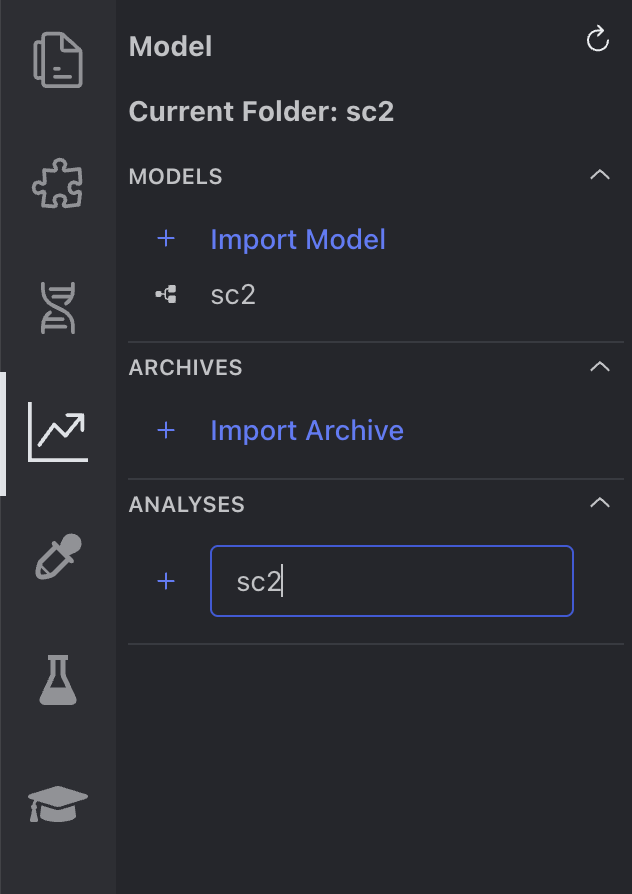
- Once you open the "sc2" folder, click on "New Design" to open SBOLCanvas from SynBioSuite (name the new design: sc2).
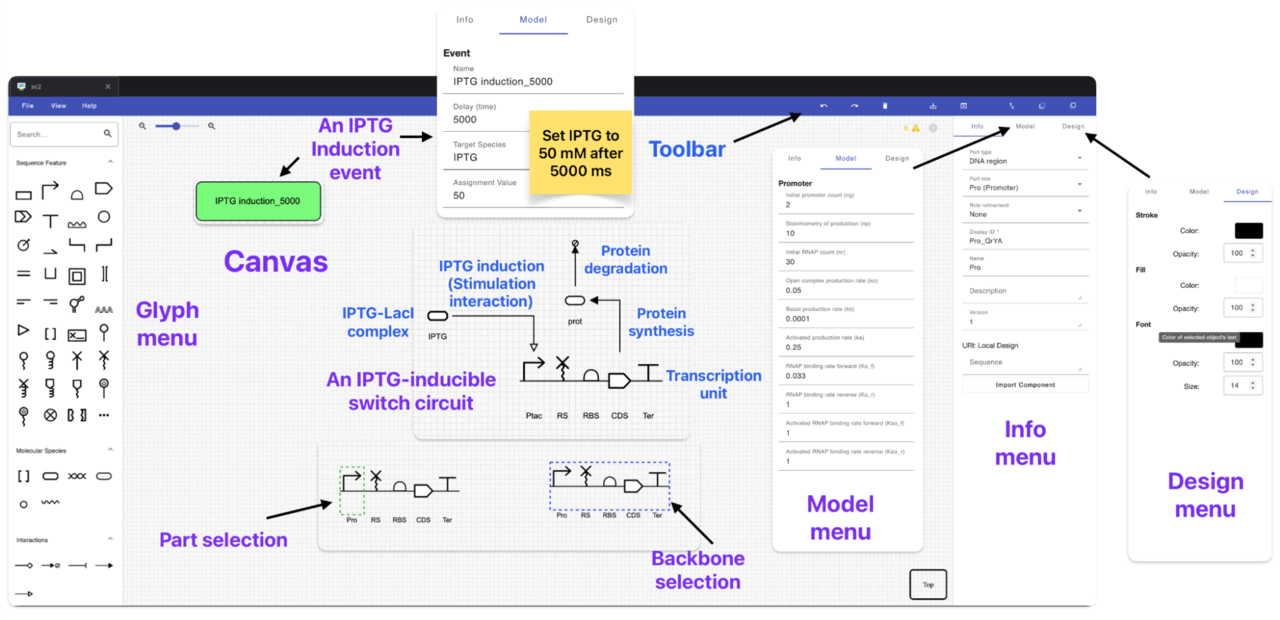
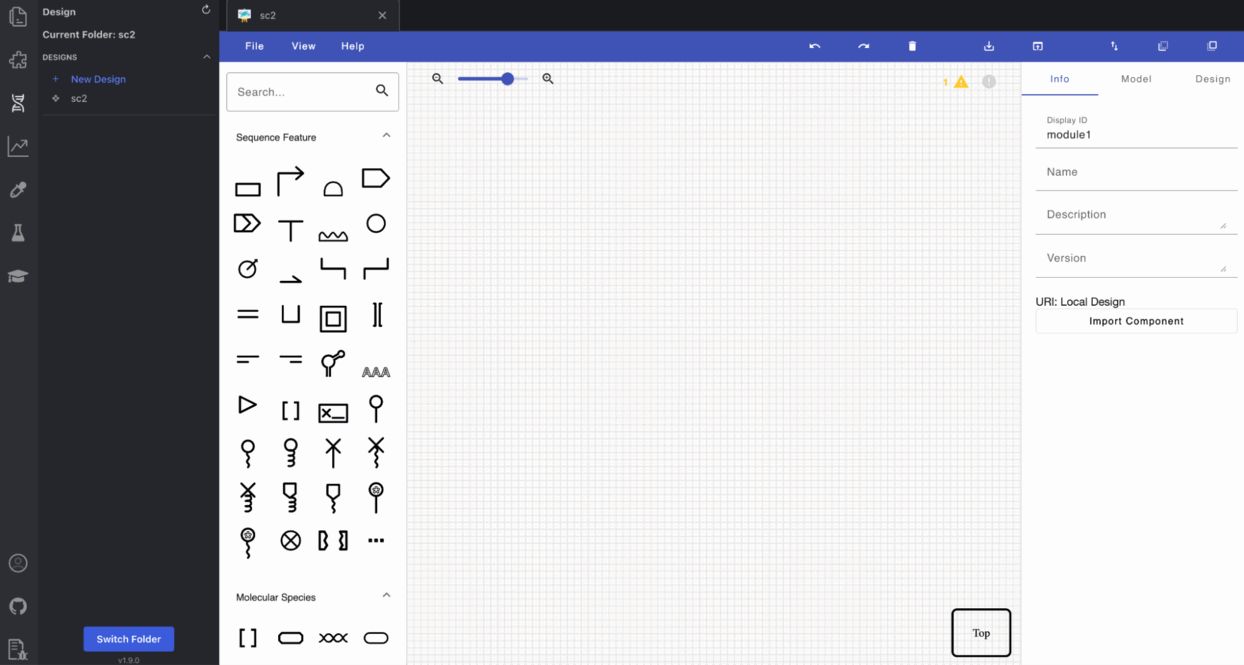
Your screen should now look like this:
Let's take a moment to familiarize ourselves with the SBOLCanvas UI. https://sbolcanvas.org/tutorial
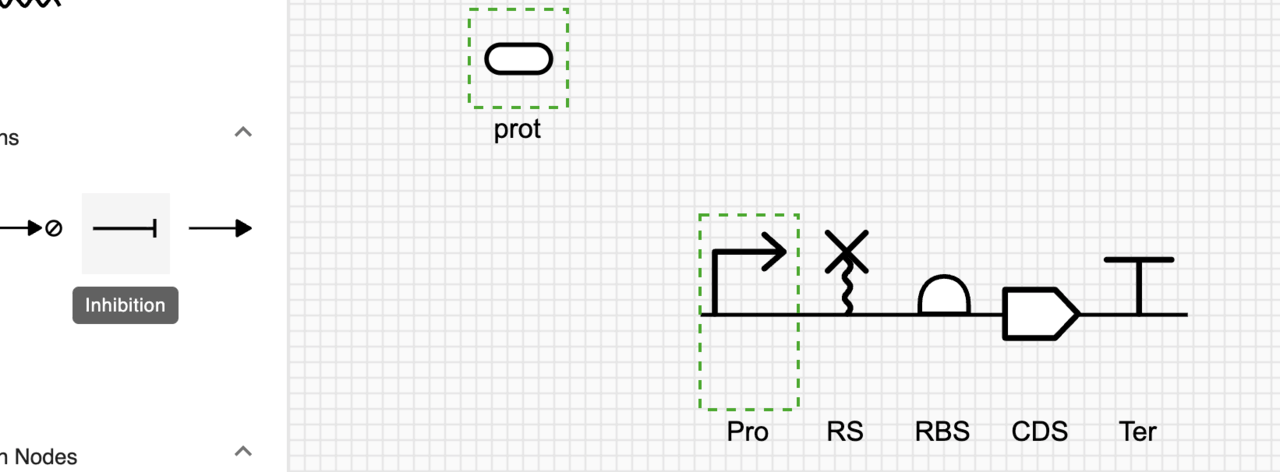
To model the sc2 genetic circuit on SBOLCanvas, we will use the glyphs on the left side glyph menu to represent the genetic parts and their regulatory interactions. Please take a moment to familiarize yourself with the glyphs by hovering the cursor over some of them to see what genetic part/interaction they represent. We will also learn how to import genetic parts from SynBioHub to SBOLCanvas and how to create "events" to represent the addition/withdrawal of circuit inputs which will be later used for circuit simulations.
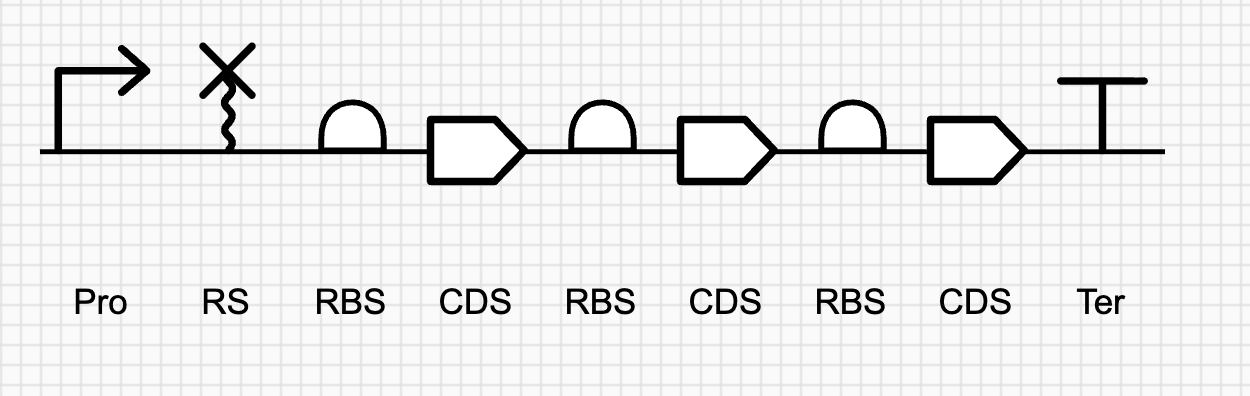
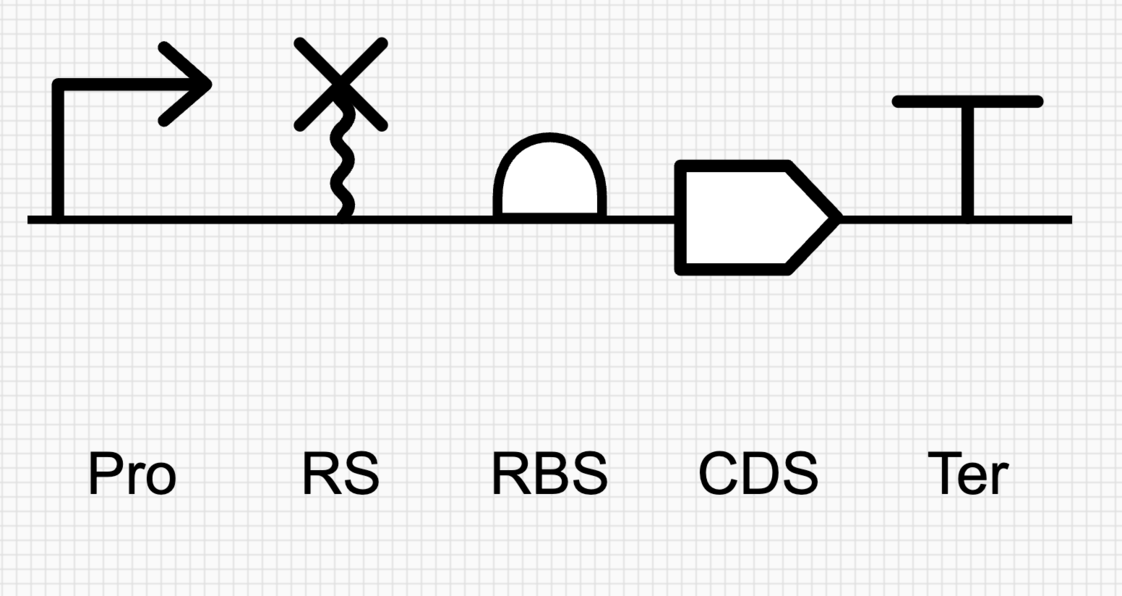
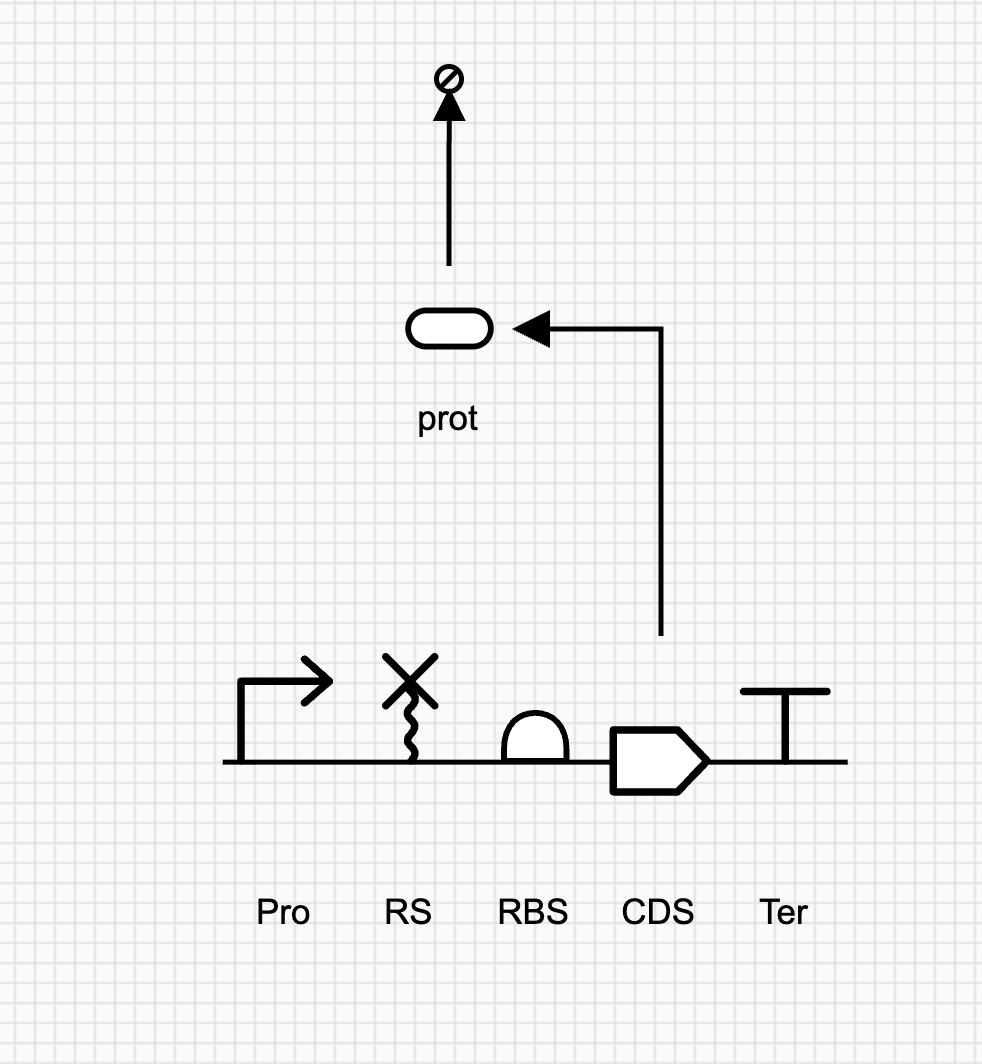
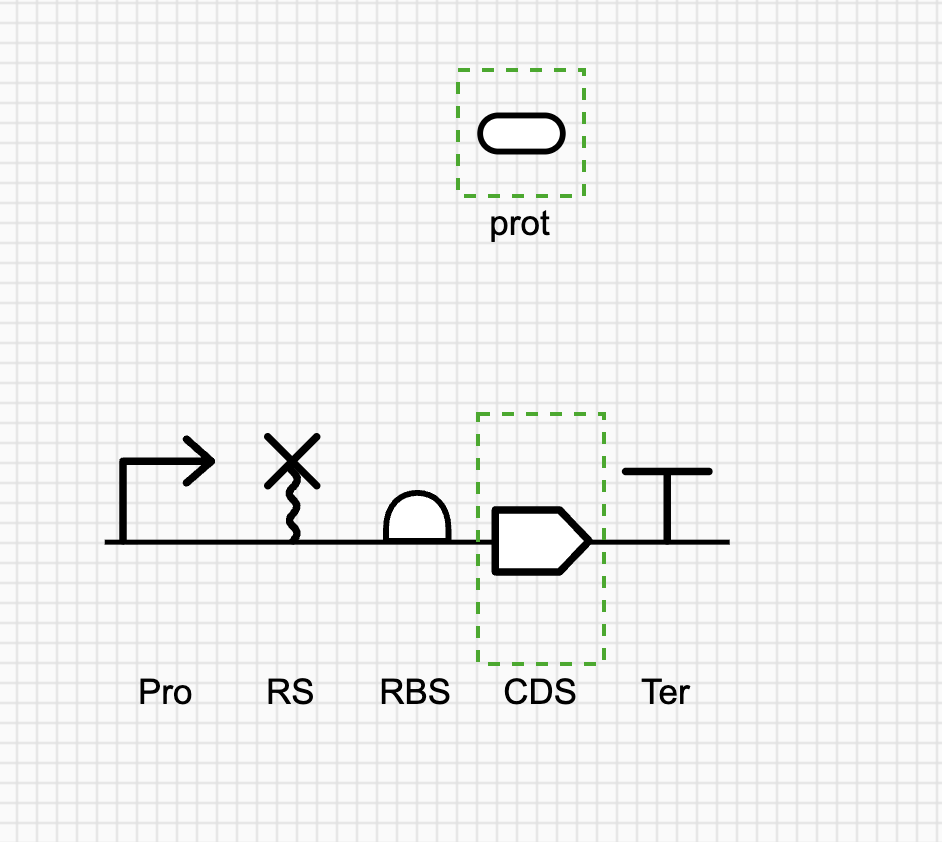
First, we will build 6 transcriptional units (TUs). To compose a TU, we need to click on each of the following glyphs consecutively:
- a DNA backbone:
- a promoter:

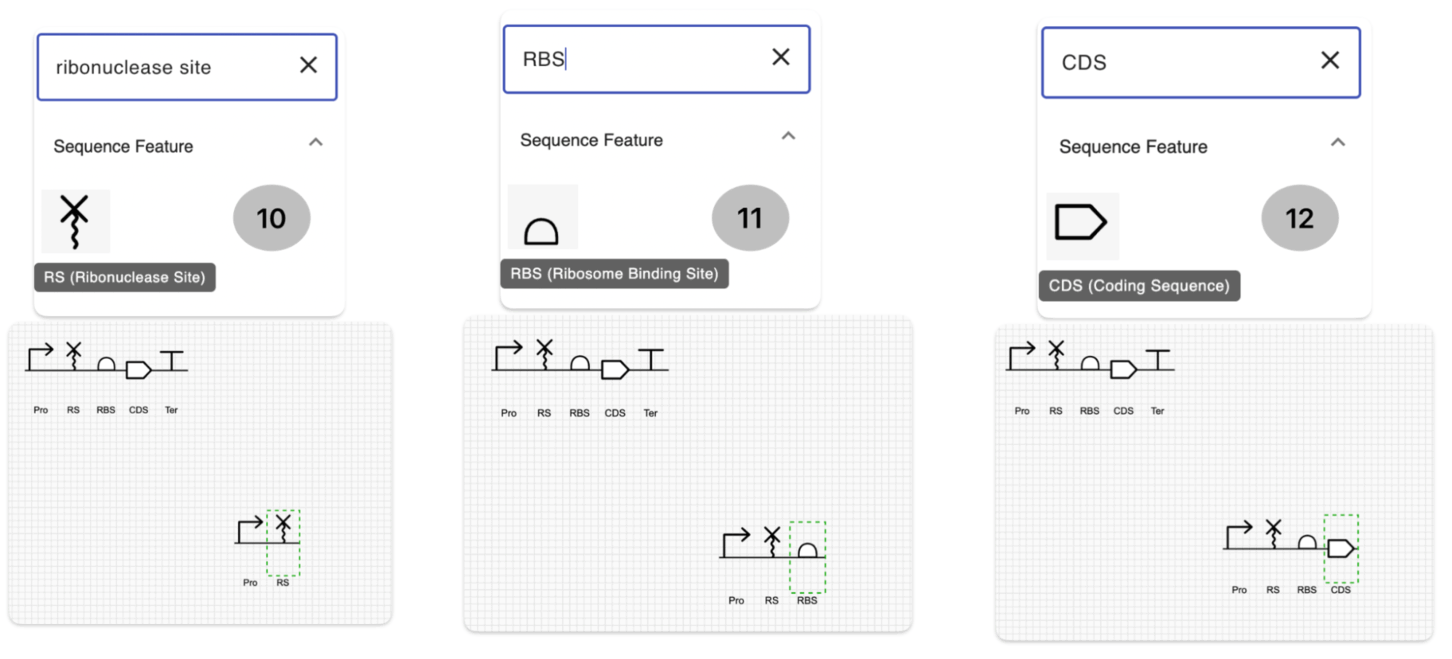
- a ribonuclease site (RS) (also called ribozyme insulator):
- a ribosome binding site (RBS)
- a coding sequence (CDS):
- a terminator:

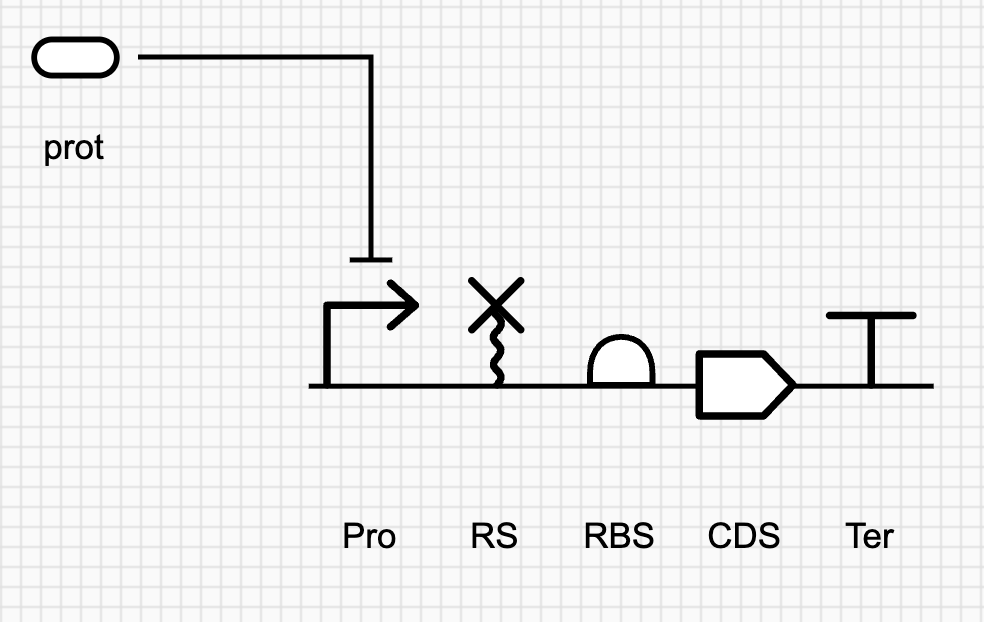
Repeat the TU creation process for the first five transcriptional units. Each one should look like this:
The last (sixth) TU is polycistronic so we need to modify the TU creation process so that we have three RBS-CDS pairs instead of one RBS-CDS pair. This TU should look like this:


So far we have built 6 transcriptional units and your Canvas should now look similar to this: To avoid any confusion, please make sure to follow the same order of the TUs from top to bottom as shown in the genetic implementation diagram of the sc2 subcircuit in the introduction section:

3.2 Creating protein production, degradation reactions, and regulatory interactions (repression and induction) between promoters and repressors
So far, we have built 6 transcriptional units. Now, we need to represent the production and degradation of the proteins encoded by each TU. We also need to represent the repression/induction of the promoters of these TUs by repressor proteins and chemical inducers, respectively.
- For each CDS, we will create:
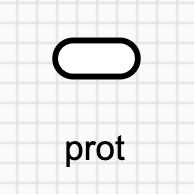
1.1- a macromolecule species to represent the encoded protein (transcriptional repressors, fluorescent protein, and output enzymes). In case the same protein is encoded by multiple CDSs, we should create ONLY ONE macromolecule species to represent that protein. For example, jr11 repressor is encoded by two CDSs so we create only one protein (macromolecular species) to represent it.
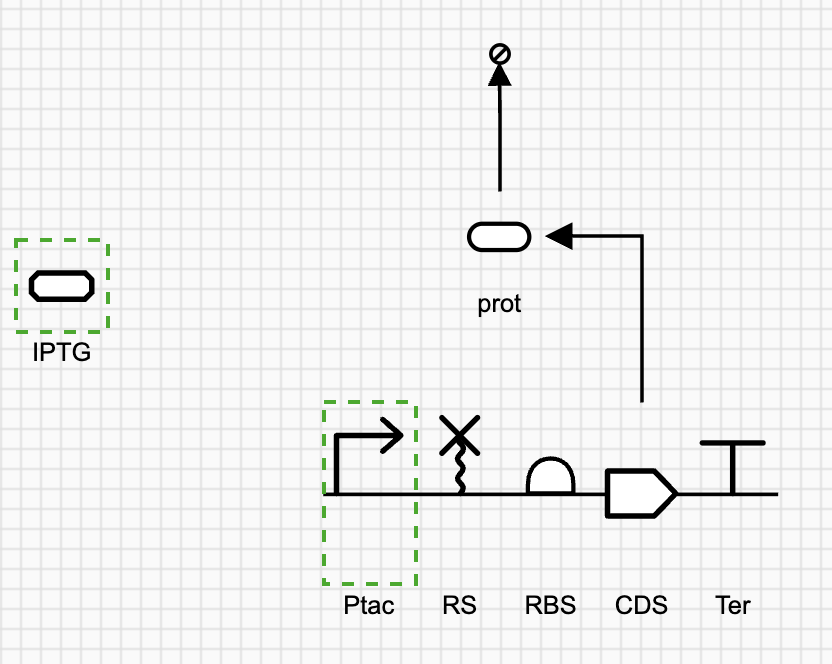
In order to connect a CDS to its encoded protein (macromolecular species), we need to create a genetic production reaction as shown in step 2.
1.2- a genetic production reaction to represent the transcription/translation process from that CDS.
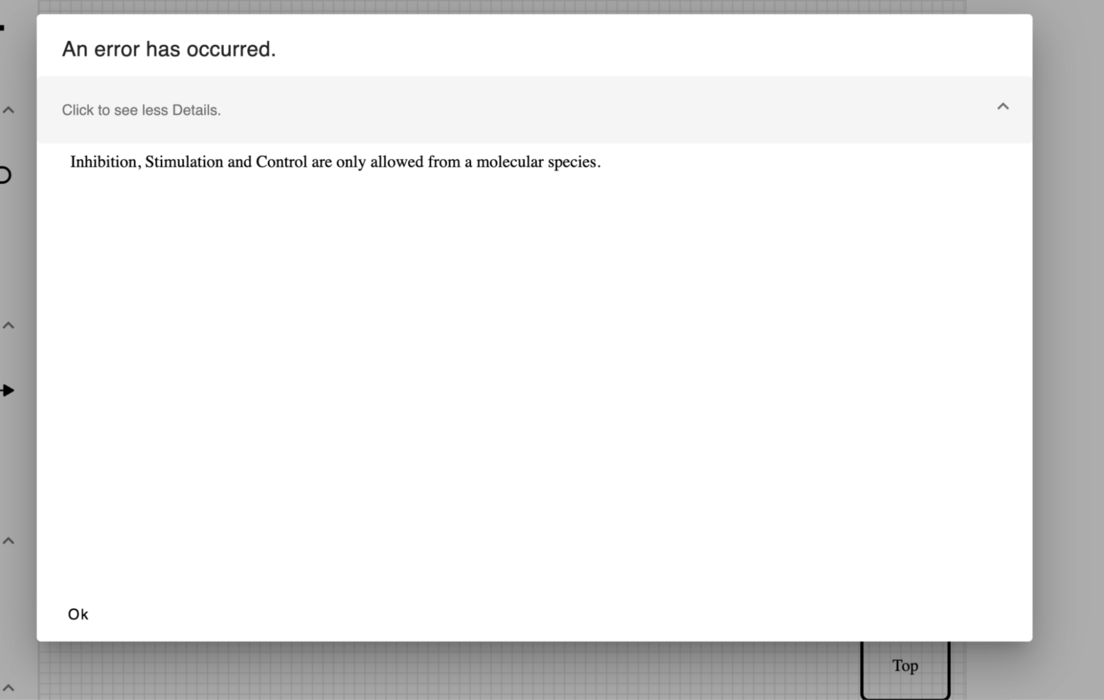
To do this, you need to co-select CDS and its corresponding protein species from above. Once both are selected, click on the Process glyph "solid arrow" which from the molecular interactions section of the glyph menu to add it to the circuit diagram. The Process glyph has the genetic production as the default interaction type. You can confirm this interaction, by dragging around the CDS or protein species where the arrow should follow along. Please note, you should select the CDS first then the protein before clicking on Process interaction glyph otherwise you will run into an error.
1.3- a protein degradation reaction for each macromolecule species/protein. To do this, you just need to click on the protein species to select it and then click on the degradation arrow from the left side panel (in the molecular interactions of the glyph menu).

Repeat the above steps for each CDS and until each CDS looks like this:
So far we have built 6 TUs and represented the production and degradation reactions of their encoded proteins. Your circuit diagram should now look similar to this:
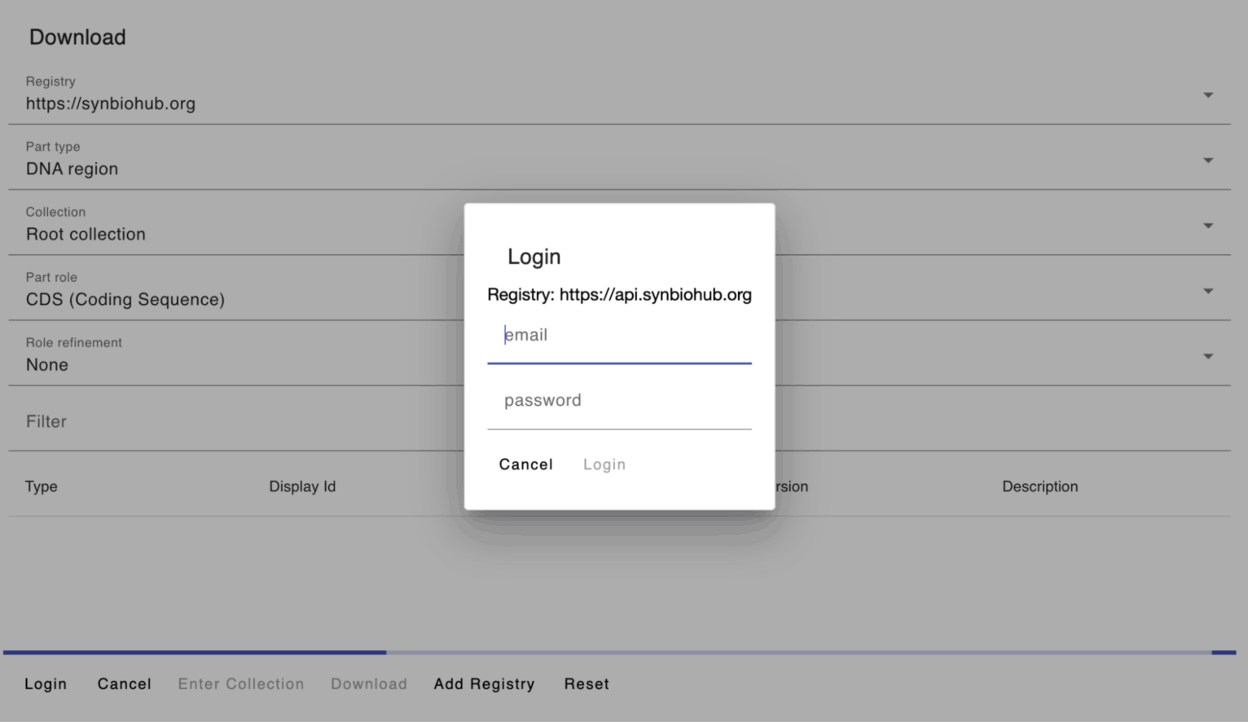
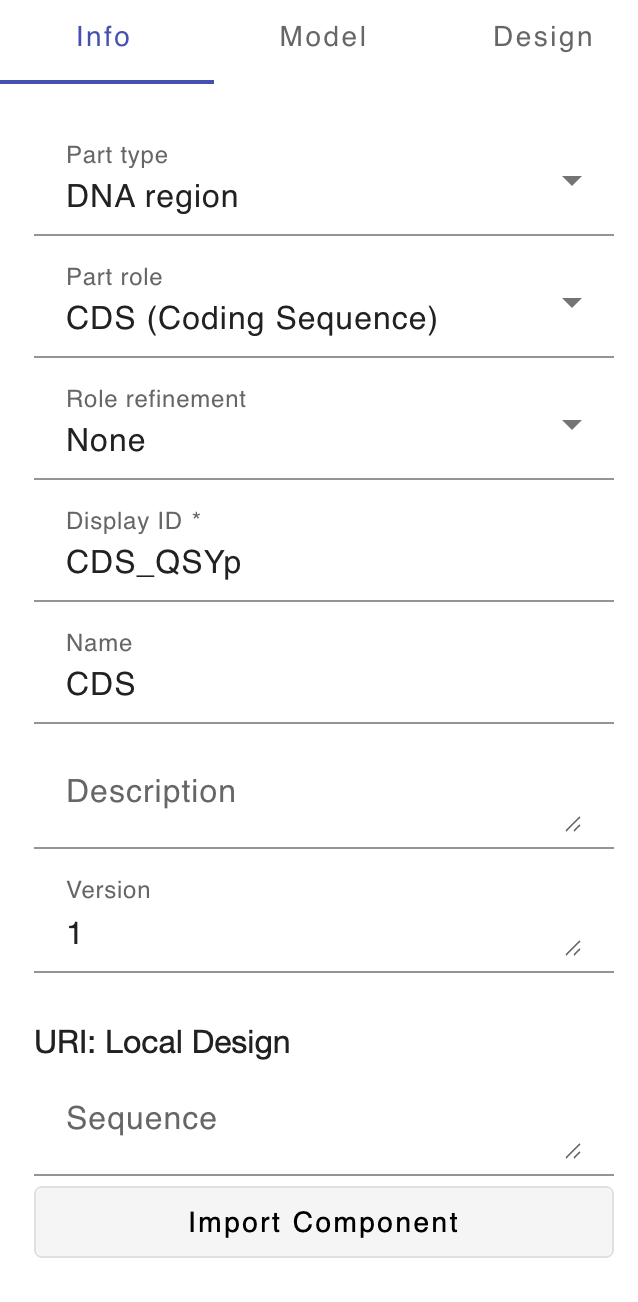
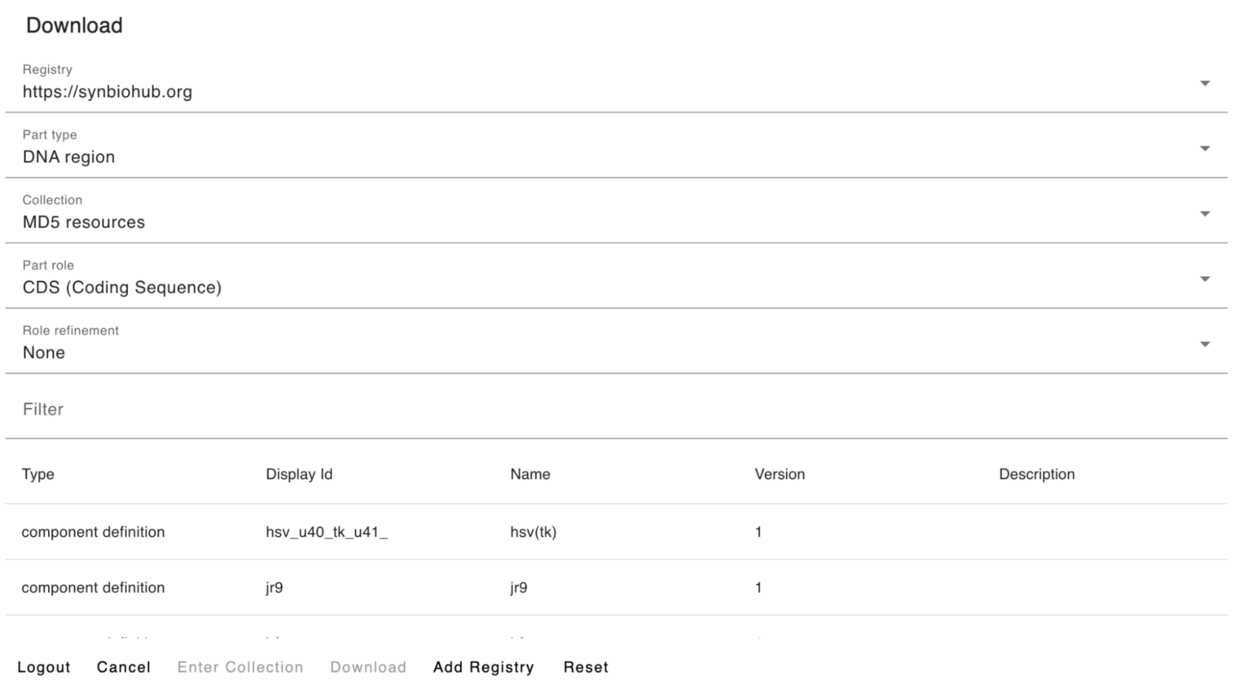
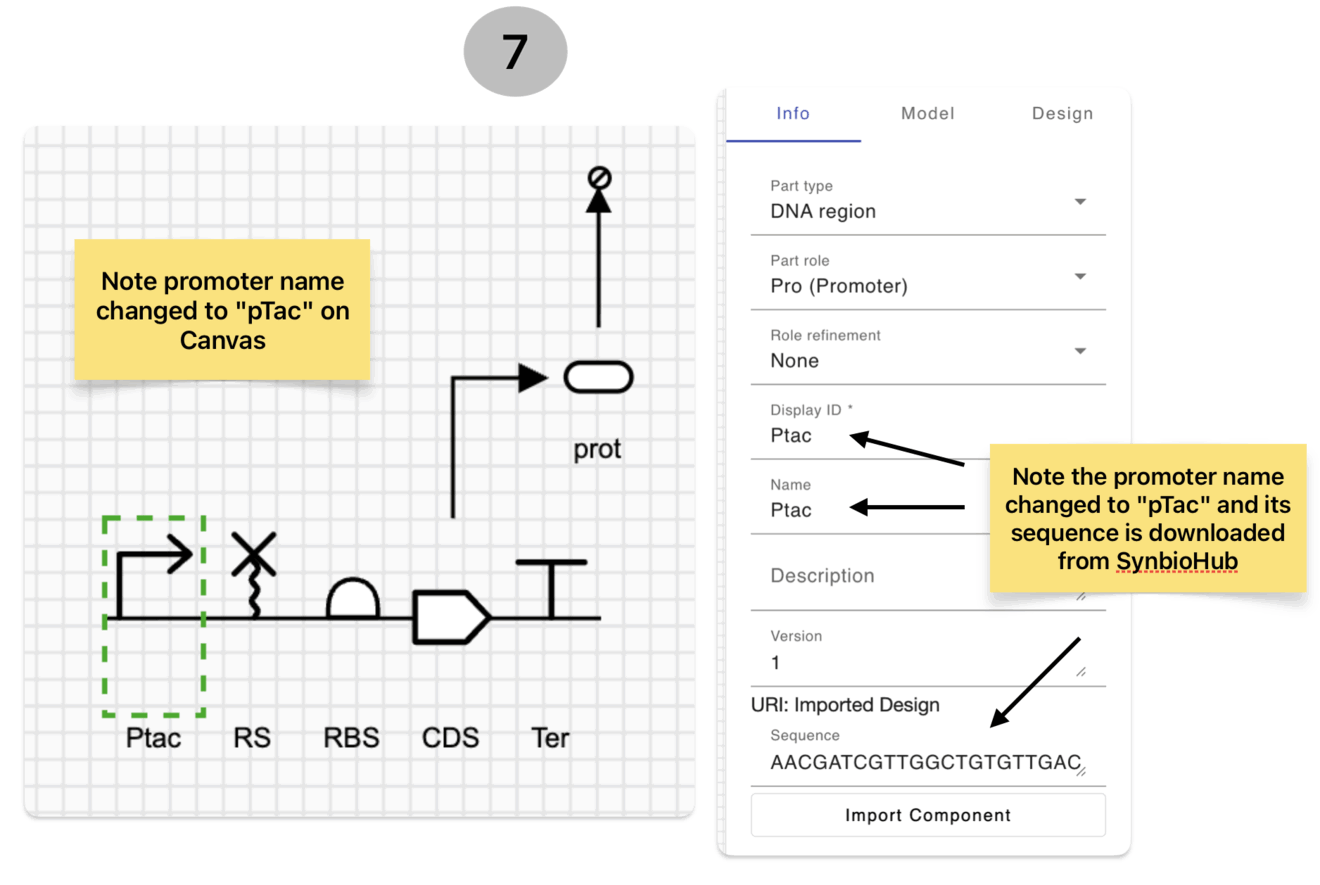
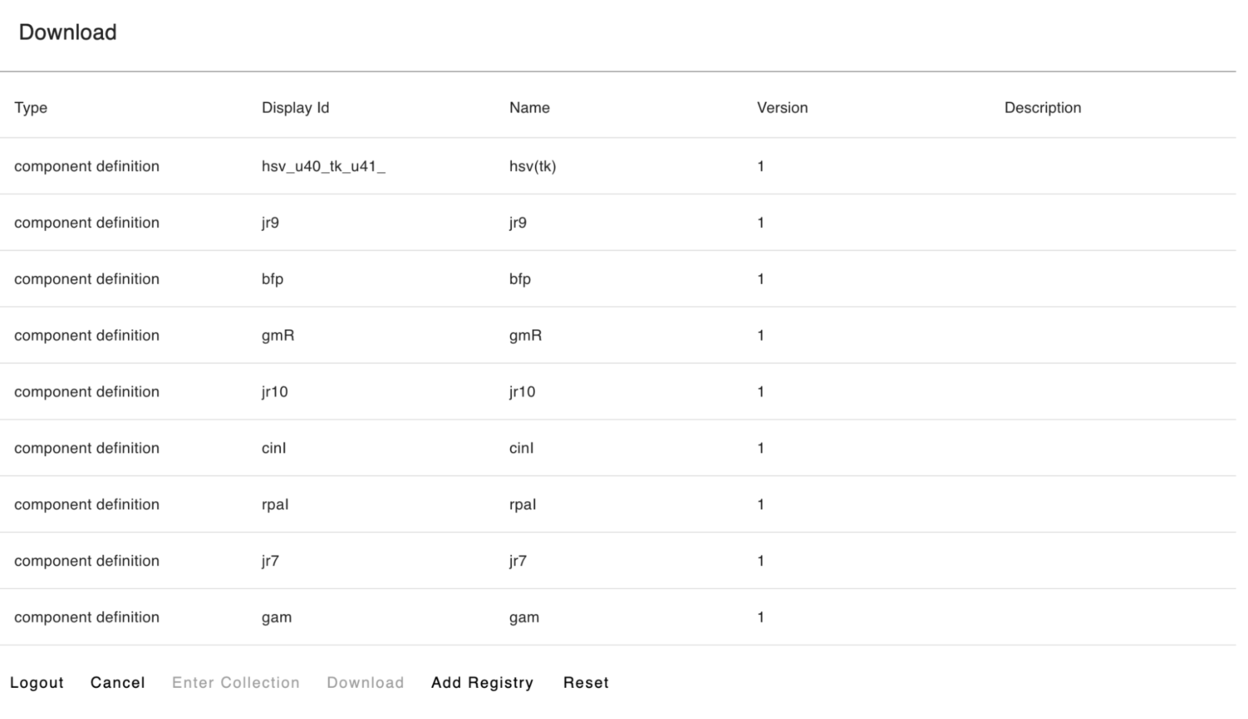
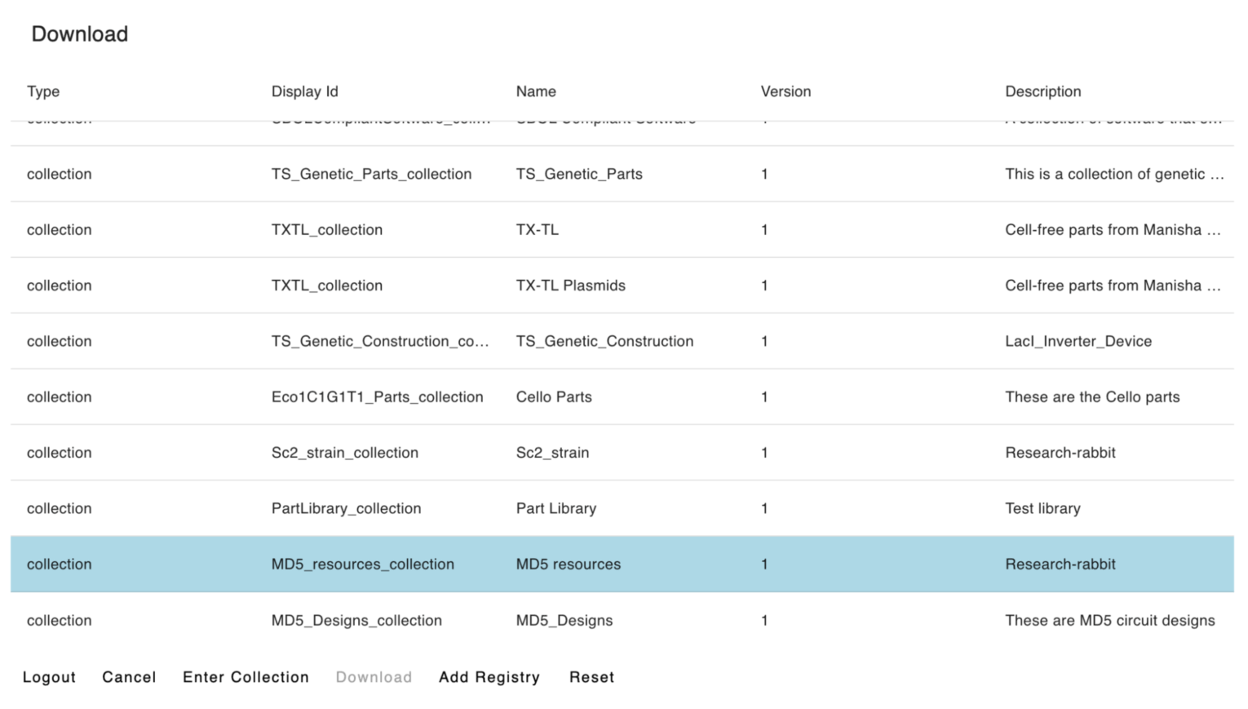
The next step is to link these proteins (transcriptional repressors) to their cognate promoters by adding the repression interactions to the circuit diagram. But before we start adding any regulatory interactions, let's take a moment to import the genetic parts for all the 6 TUs and their encoded proteins from SynBioHub using the "Import Component" from the "Info Menu" of each genetic part (you need to select the part first to view its Info Menu). The detailed steps/screenshots for importing parts from SynBioHub are shown in section 3.3. Your screen should now looks like this:
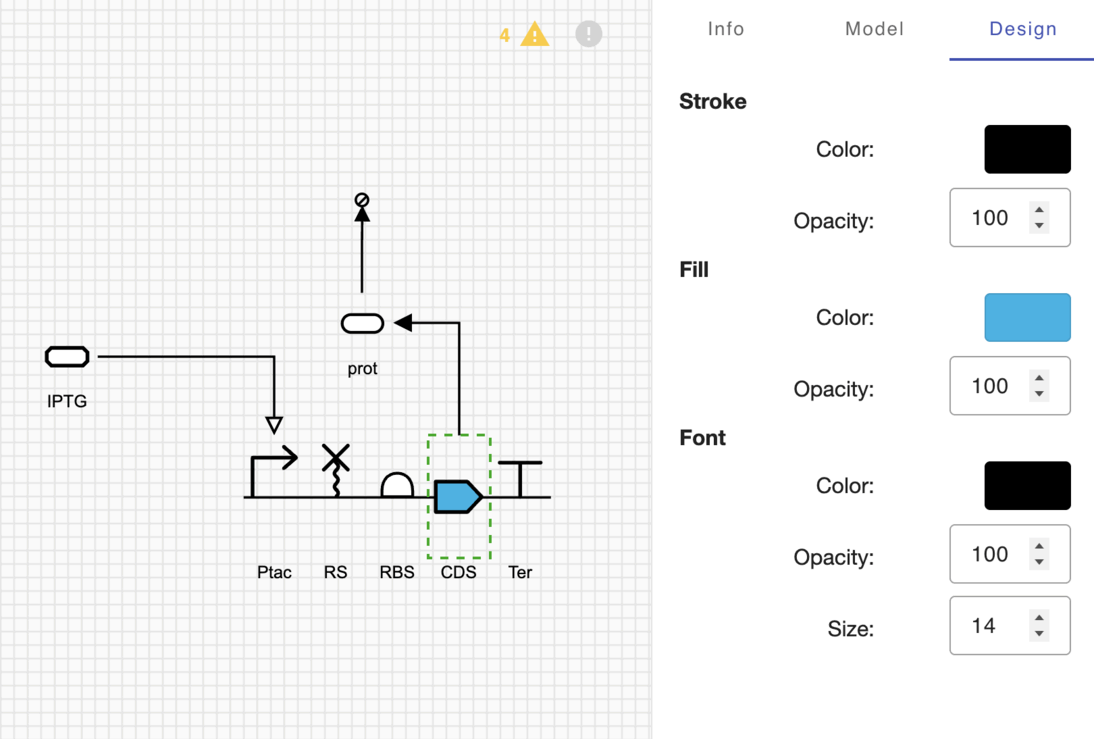
After importing parts from SynBioHub, we will use the "Design Menu" of each part to color code the CDS and protein species of each repressor and its cognate promoter to guide us when connecting them together using the repression/inhibition interaction glyph. For example, jr11 CDS produces j11_protein which represses the PJR11 promoter so we give them the same color (blue). In the "Design Menu", for the CDS/proteins we need to change the color in "Fill" while for promoters we change the color in "Stroke".
So far, we have created 6 TUs and their encoded protein species. We also created the production and degradation reactions of each protein. We also imported genetic parts from SynBioHub and color coded the CDS/protein species of each repressor and their cognate promoters to guide us while connecting them. Now, we are ready to create regulatory interactions between each repressor and its cognate promoter. Your screen should now look like this:
- For each promoter we need to create the repression/induction reactions as follows:
Except for pTac and pBAD promoters, we will create a repression interaction between each transcriptional repressor ( jr7 and jr11) and its cognate promoter (pJR7 and pJR11) using the inhibition glyph from the molecular interactions section of the glyph menu. To do this, we need to co-select the transcriptional repressor and its cognate promoter by holding the CMD key on MacOS or Ctrl key on Win. Please make sure to select the repressor protein species first before selecting the promoter otherwise you would run into an error when creating the interaction.
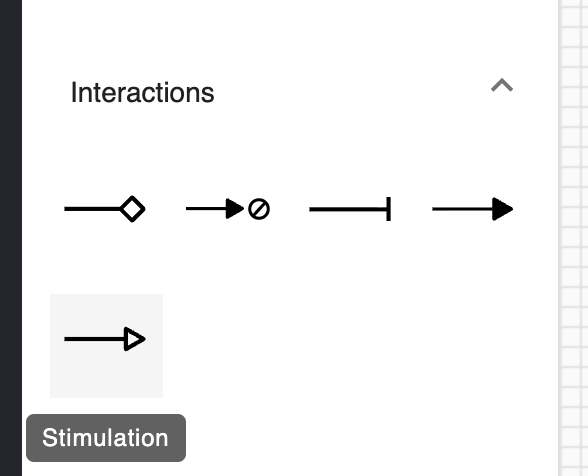
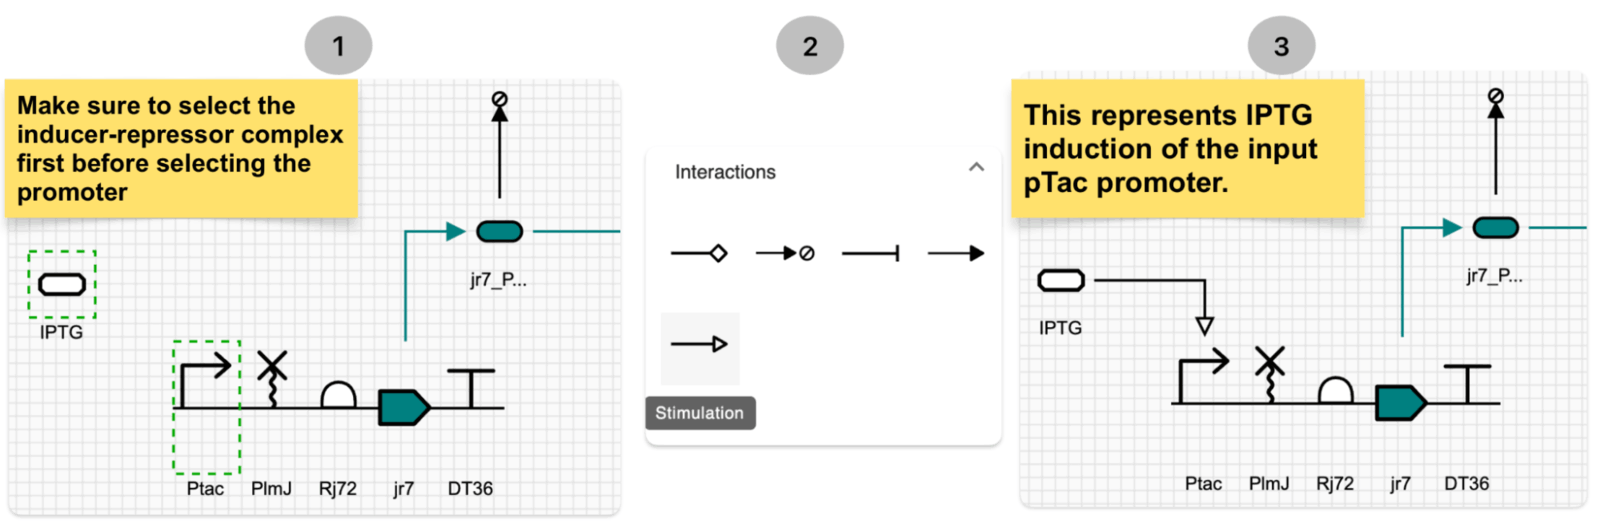
For the two input inducible promoters (pTac and pBAD), we will create stimulation interactions to represent IPTG and Ara inductions, respectively. But first we need to create two complex species to represent the inducer-repressor complexes (IPTG-LacI and Ara-AraC). For simplicity, we will name the IPTG-LacI complex as just "IPTG" and the Ara-AraC complex as just "Ara".
To represent induction, we need to select each complex and its cognate promoter simultaneously and click on the stimulation reaction glyph. You should select the complex first before selecting the cognate promoter before clicking on the Stimulation interaction glyph (otherwise you will run into an error).
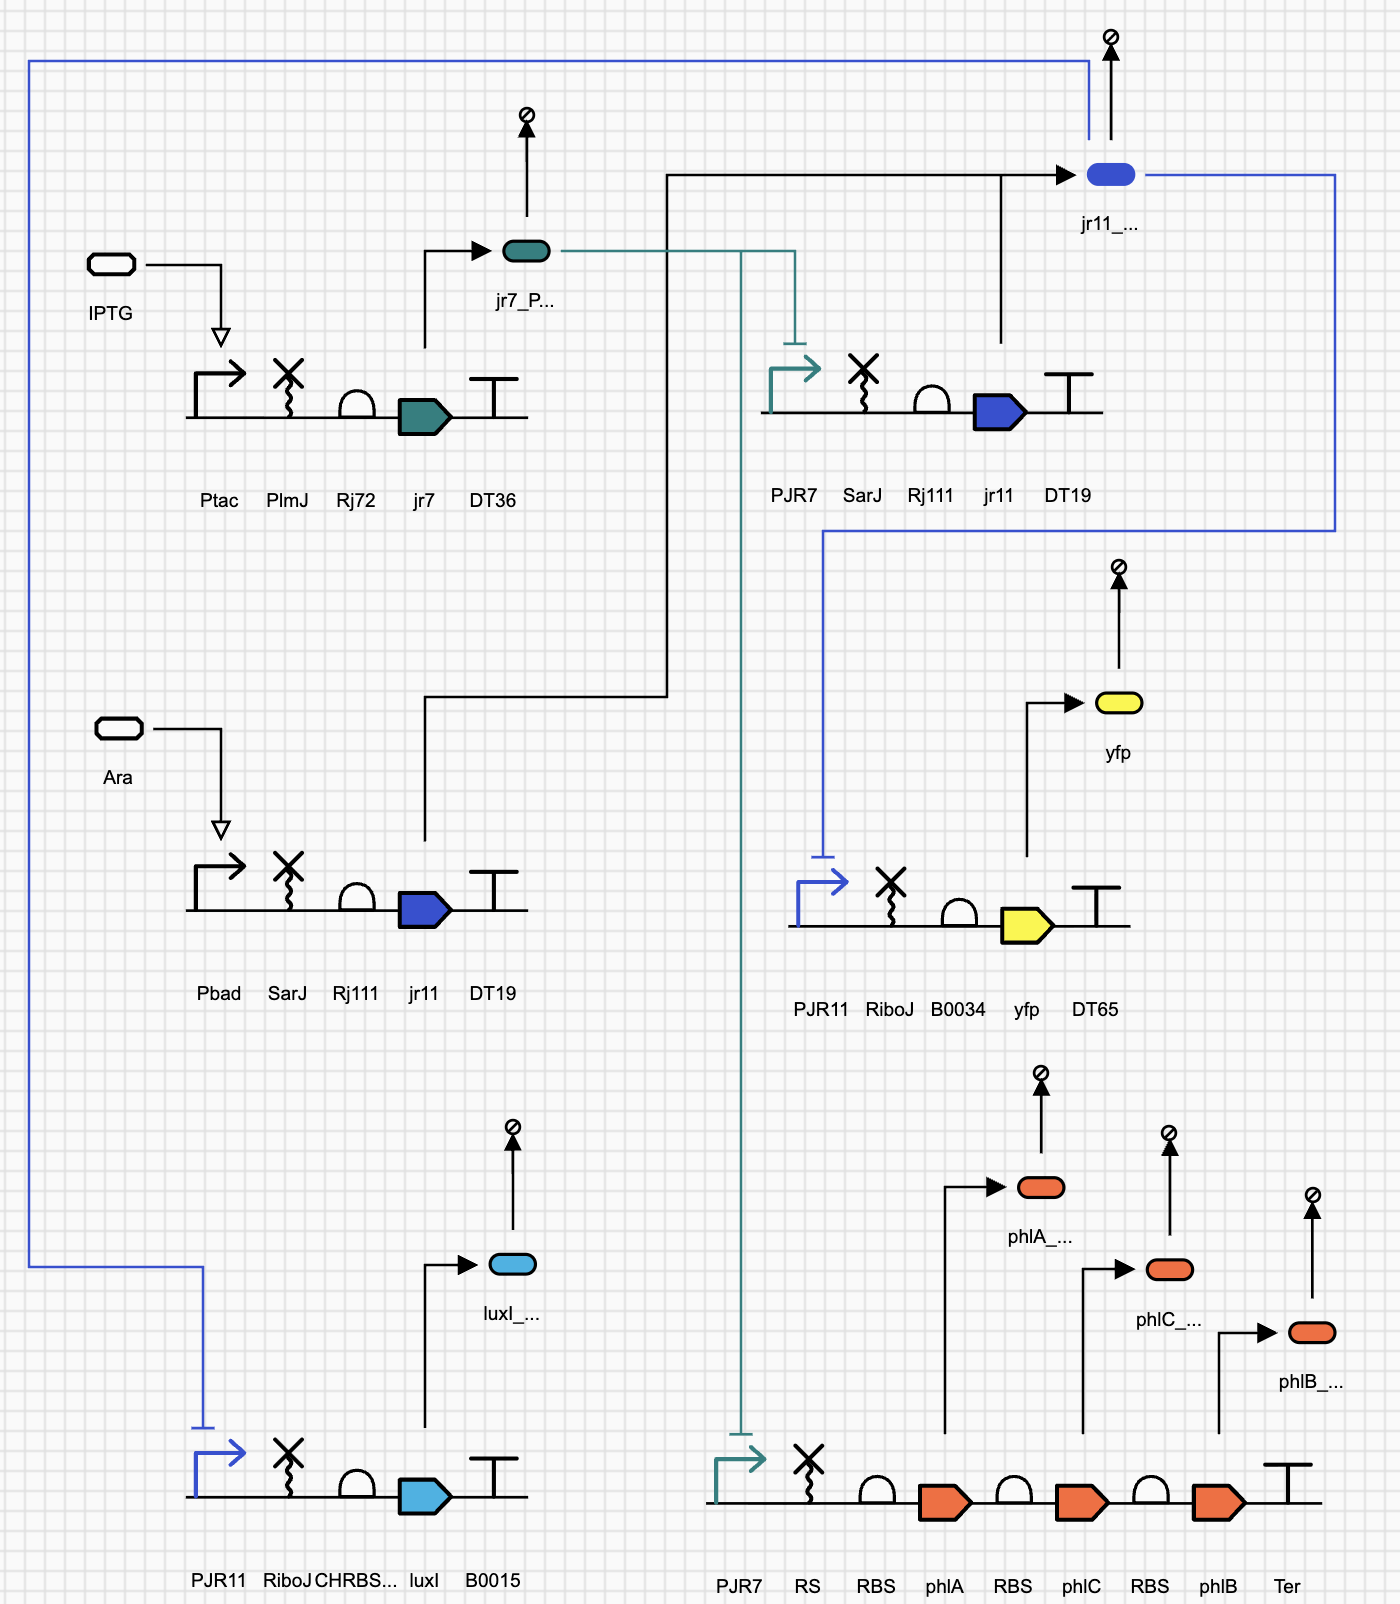
After adding the repression and induction interactions, now we have completely modelled the sc2 subcircuit on SBOLCanvas and it should look like the screenshot below. The next step is to simulate this model on SynBioSuite to analyze its logical behavior. But before we do the simulation, we need to add "Events" to represent the addition and withdrawal of inducer molecules (IPTG and Ara) at different time points. Event creation is covered in section 3.4 of this tutorial.
This is the complete circuit diagram of the sc2 subcircuit
3.4 Creating events for the addition/withdrawal of input inducer molecules to simulate circuit behavior
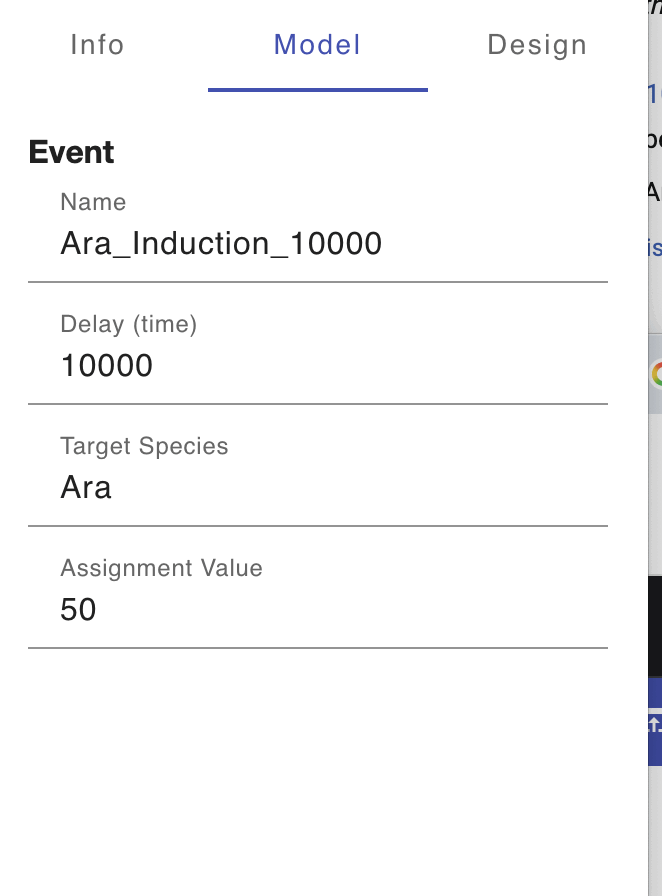
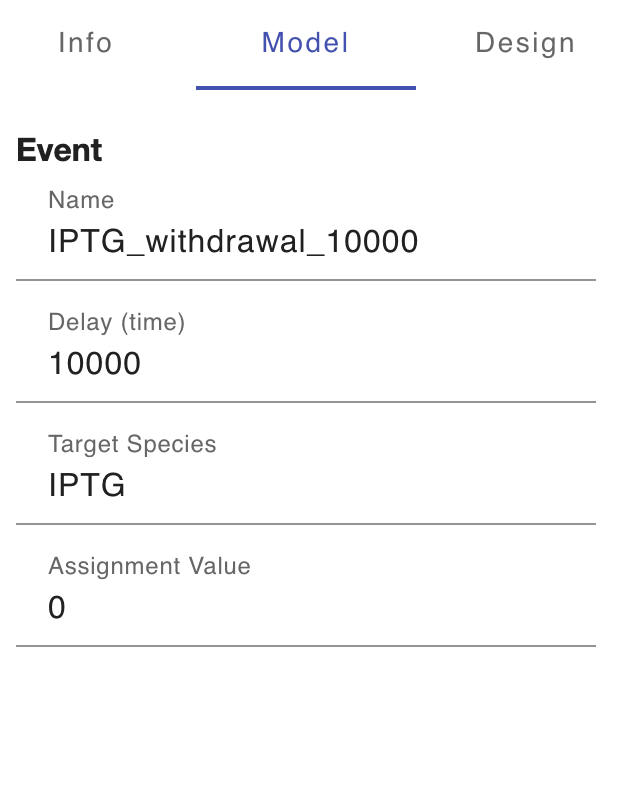
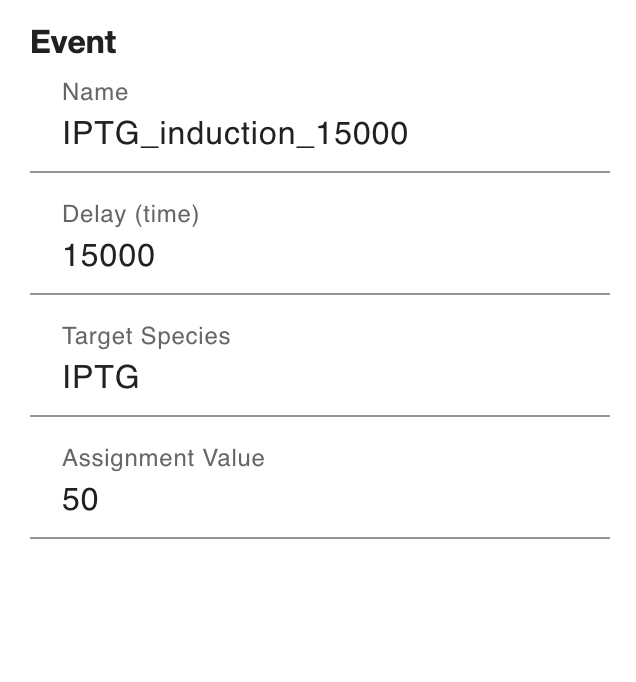
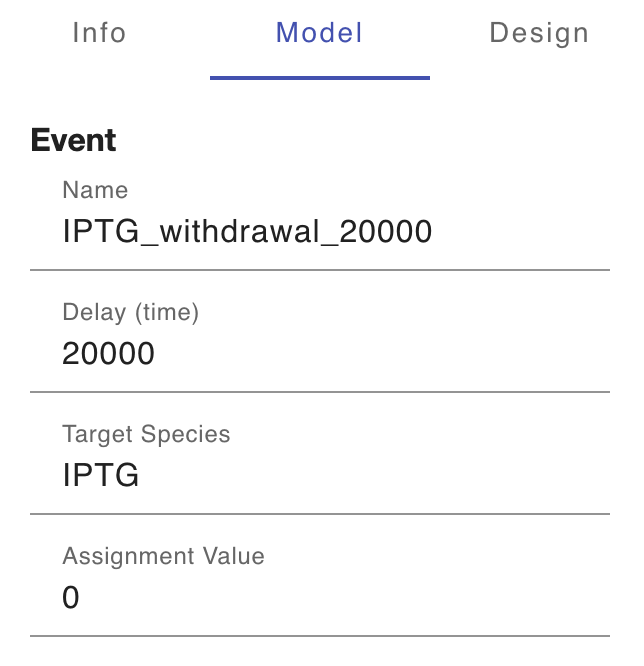
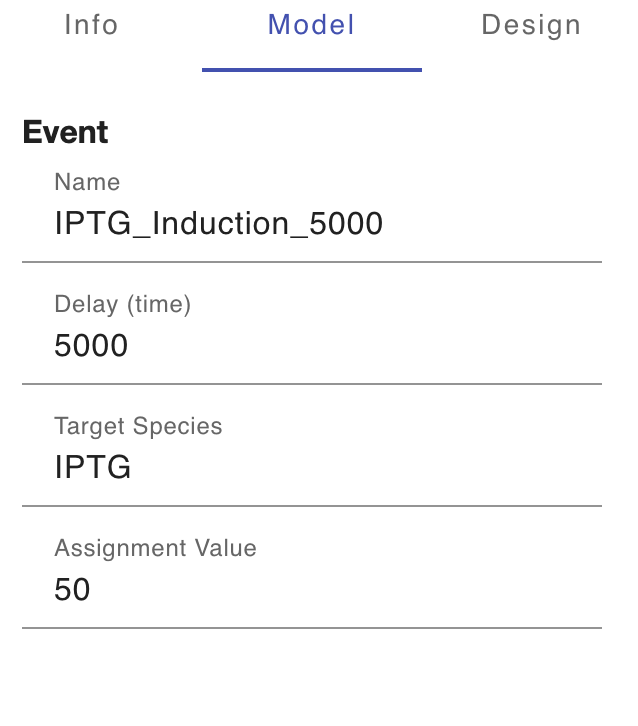
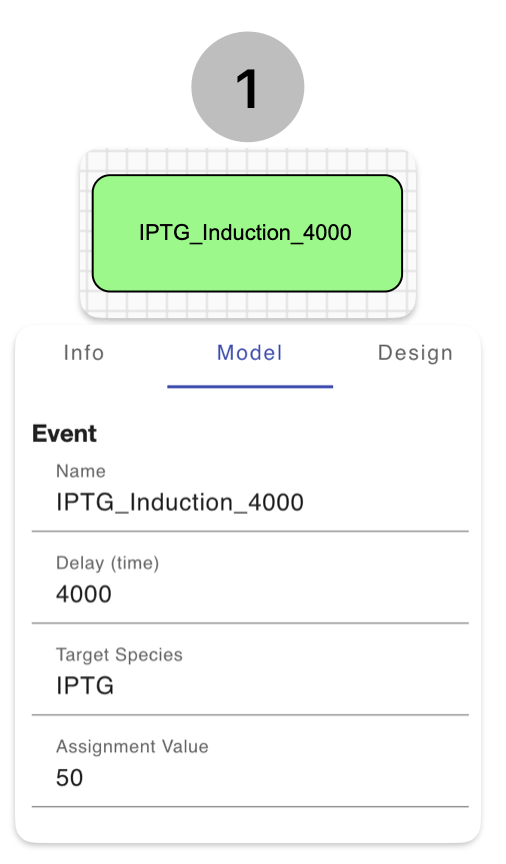
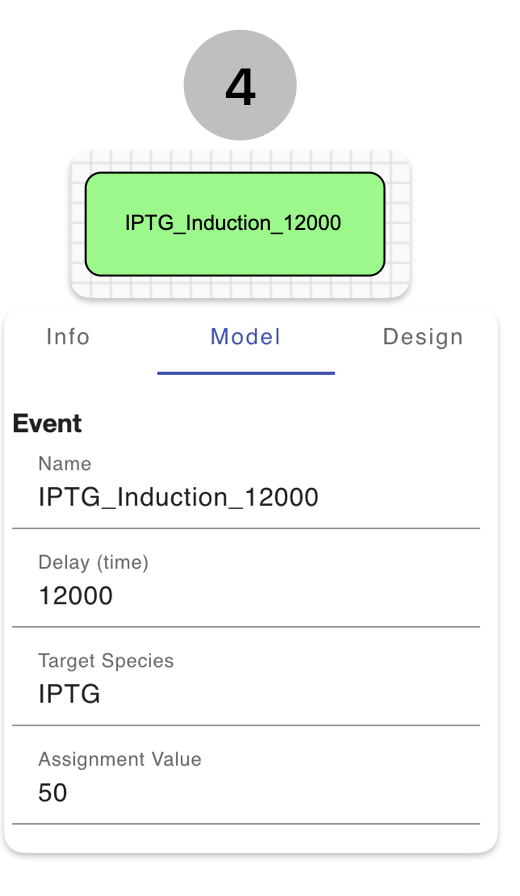
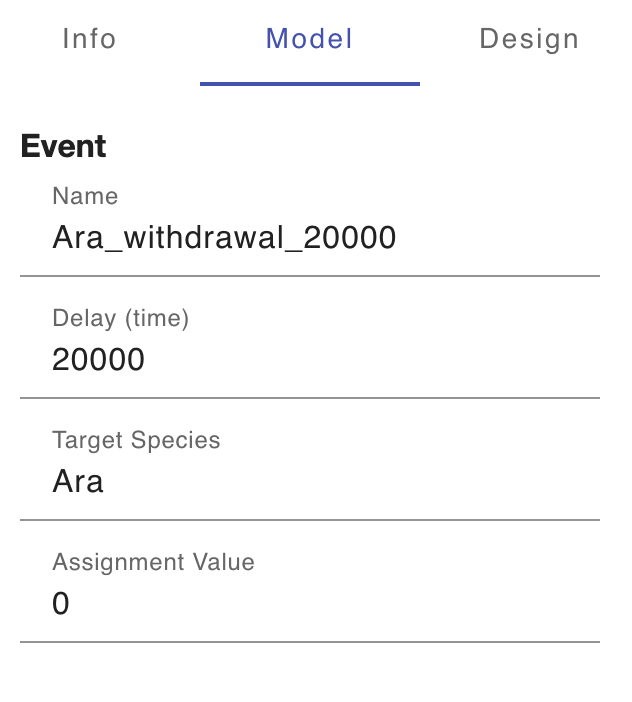
Before we can simulate circuit behavior on SynBioSuite (using the iBioSim backend), we need first to represent the addition/withdrawal of inducer molecules (circuit inputs) over time. An event is used to assign specific values to target molecules after a specific delay time. For example, we can create an event to represent IPTG induction by setting IPTG concentration to 50 mM after a delay time of 4000 ms. We can also create another event to withdraw/washout IPTG by setting its concentration to 0 after a delay time of 8000 ms. We can set these event parameters using the Model Menu of the event as shown below.
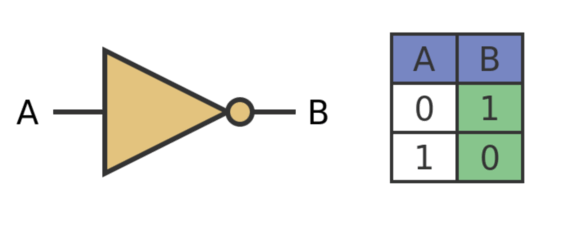
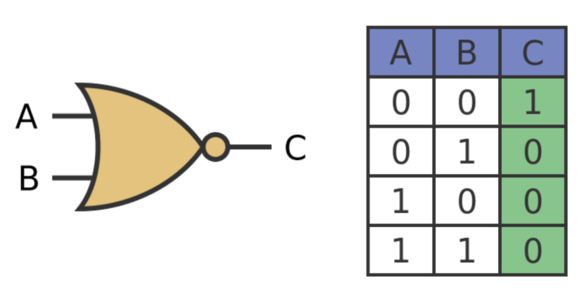
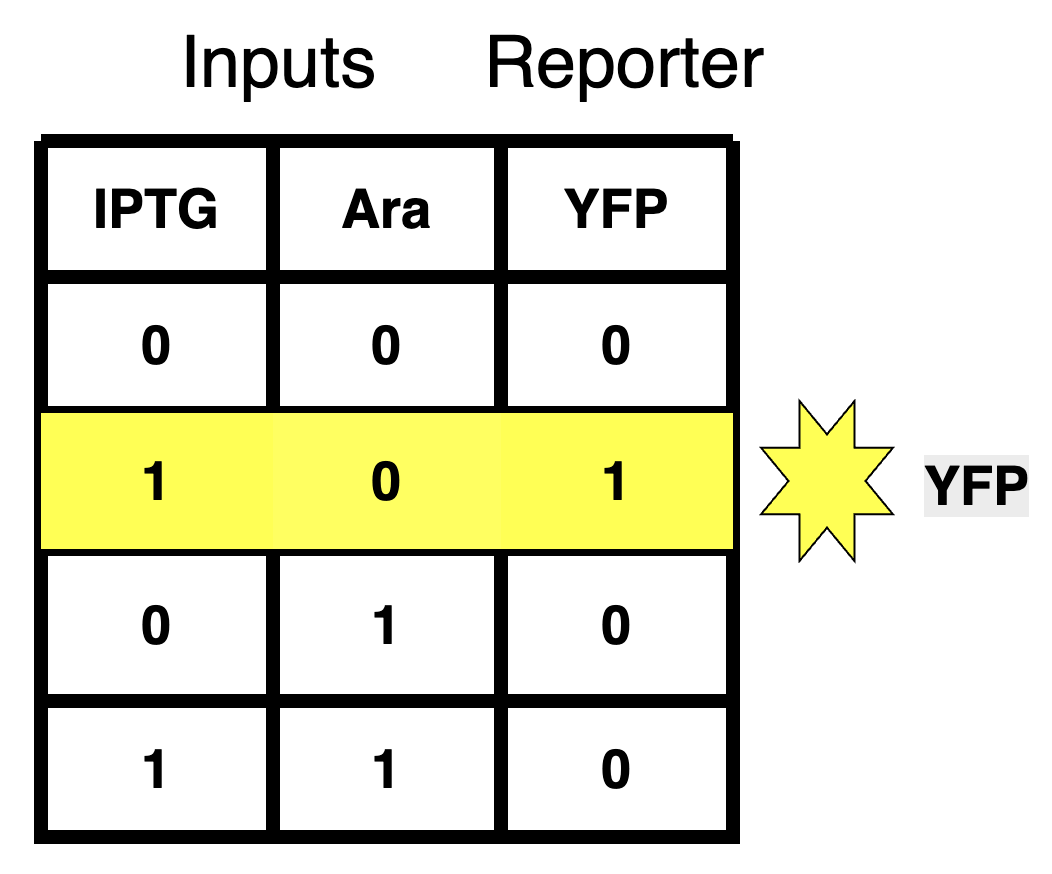
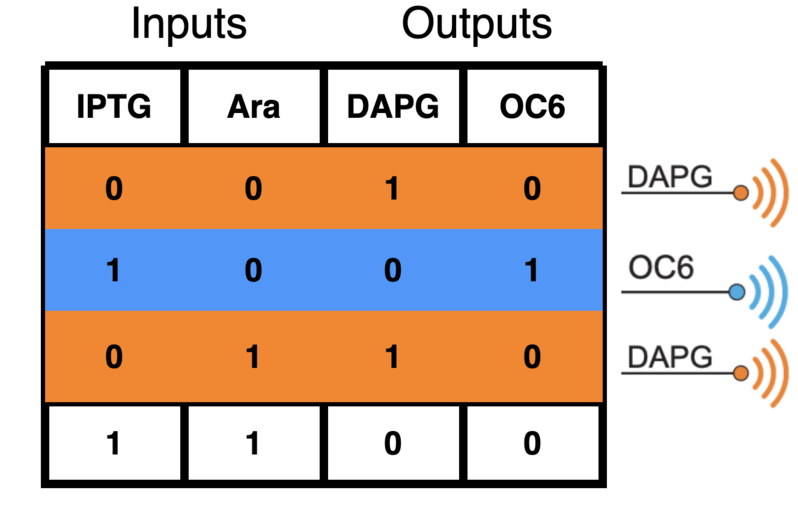
To find out what events should be created, we need to take a look at the truth table and take note of all the possible combinations of inputs (IPTG and Ara).
From the above truth table we can see that there are four possible input combinations:
- IPTG low, Ara low
- IPTG high, Ara low
- IPTG low, Ara high
- IPTG high, Ara high
Let's explain how to represent the above input combinations using events:
-
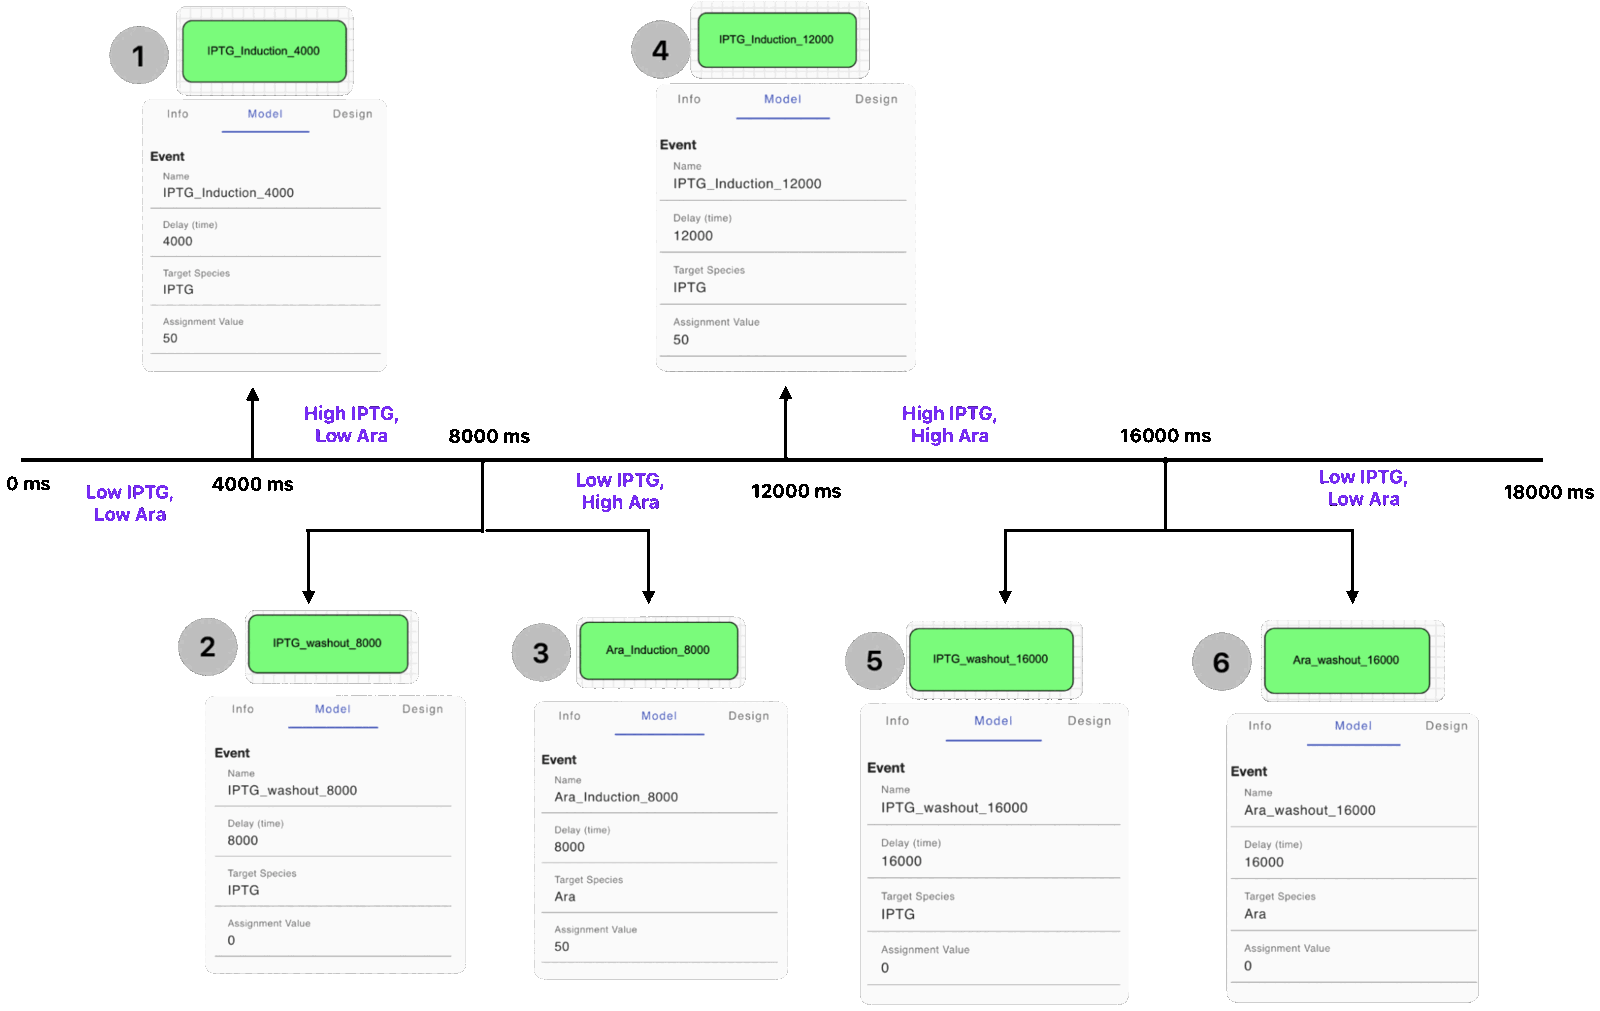
IPTG low, Ara low: No events are needed at the beginning of the simulation as both inputs are low by default assuming we started the simulation with 0 initial values for IPTG and Ara.
-
IPTG high, Ara low: We need to create only one event to set IPTG to high concentration (50 mM) after a delay time of 4000 ms (IPTG induction). No event is needed for Ara because it already exists in low initial concentration.
- IPTG low, Ara high: We need to create two events to represent the withdrawal/washout of IPTG as well as the addition of Ara (Arabinose induction). For IPTG washout, we need to set IPTG concentration to 0 after a delay time of 8000 ms. For Ara induction, we need to set Ara concentration to 50 mM after a delay time of 8000 ms.
- IPTG high, Ara high: We need to create only one event to represent IPTG induction by setting IPTG concentration to 50 mM after a delay time of 12000 ms. Please note that we do not have to create an Ara induction event because Ara is already high starting from the previous induction event at 8000 ms.
We are interested in measuring the time evolution of circuit response to not only the levels of the input inducers (high vs low) but also the transitions between different inducer levels (e.g. high to low vs low to high). It is important to verify circuit logic when both IPTG/Ara simultaneously transition from high to low states at the end of the simulation. For that, we need to create two additional events to represent the withdrawal/washout of both IPTG and Ara. To do so, we need to create two events to set IPTG and Ara to 0 after a time delay of 16000 ms.
Now, we have completed sc2 subcircuit modelling on SBOLCanvas with all the events necessary for running circuit simulation on SynBioSuite. Your circuit model should now look like this:


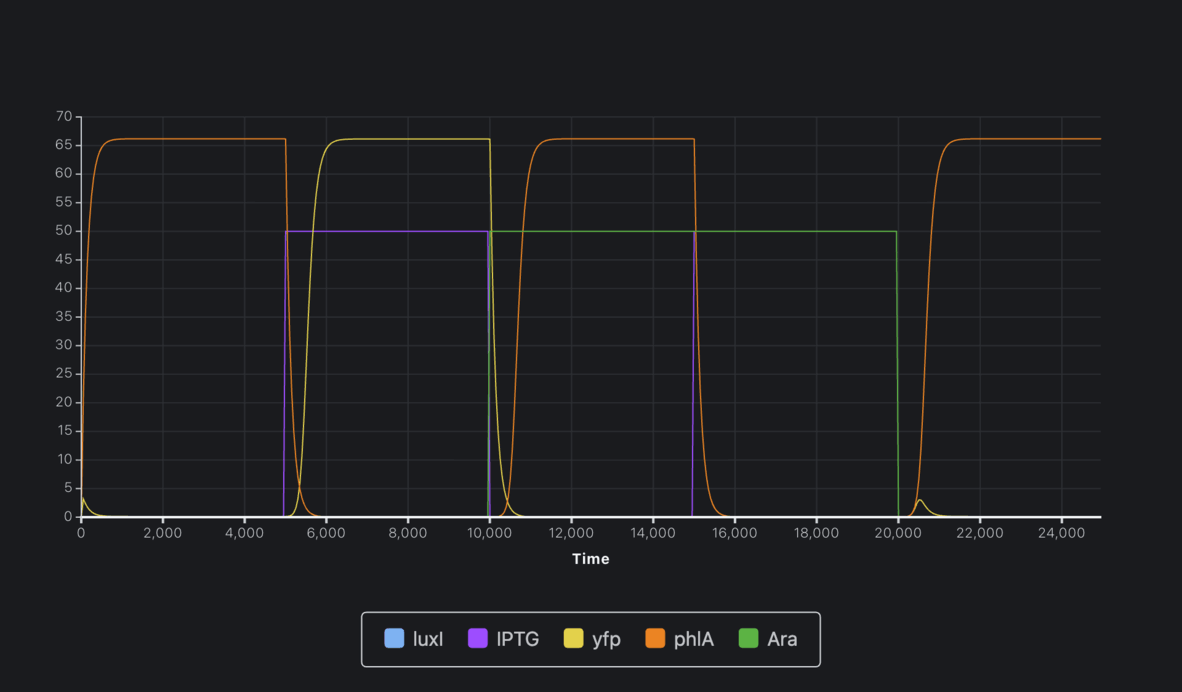
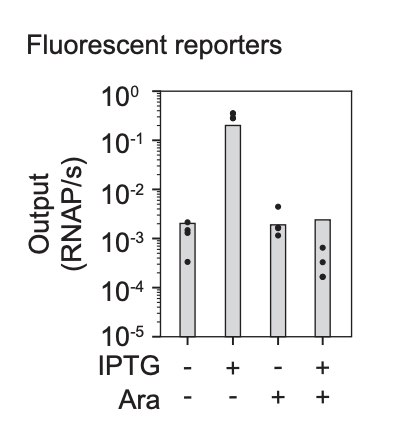
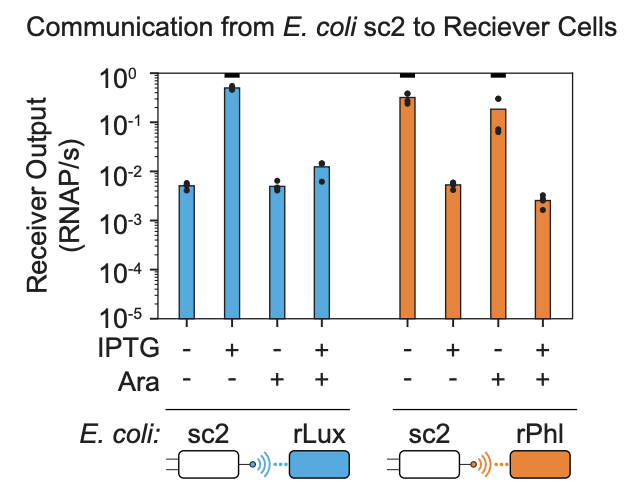
By comparing model prediction to experimental data, we can see yfp reporter is only produced in the presence of IPTG and absence of Ara (High IPTG, Low Ara) (4000 ms to 8000 ms).
By comparing model prediction to experimental data, we can see phlA_protein (and hence its output DAPG) is only produced in two input combinations: (Low IPTG, Low Ara) (first 4000 ms) and (Low IPTG, High Ara) (8000 ms to 12,000 ms). Similarly, luxI_protein (and hence its output OC6) is only produced in one input combination: High IPTG, Low Ara ( 4000 ms to 8000 ms).