🎯 Telecom Operations Specialist | Data & Analytics | AI & Automation
📍 Brazil
Telecom Operations Specialist with strong experience in data analysis, automation, and process optimization, focused on improving operational efficiency through data analysis, automation, and process optimization.
I work at the intersection of operations and analytics, supporting decision-making with data-driven insights and performance monitoring.
- 25+ years of experience in telecom operations
- Experience in operational management and performance monitoring
- Strong background in SLA, backlog control, and service operations
- Experience leading and supporting teams and projects through operational and data-driven initiatives.
💡 I focus on:
- Improving operational performance (SLA, backlog, MTTR)
- Automating processes and reducing manual workload
- Turning data into actionable insights for decision-making
- SLA Monitoring
- Backlog Management
- Operational KPIs
- Python (pandas, numpy, scikit-learn)
- Machine Learning (Regression, Classification)
- Statistics & Hypothesis Testing
- SQL (Joins, CTEs, Window Functions)
- Power BI (Dashboards, DAX)
- Excel
- Git & GitHub
- VS Code
- Docker (basic knowledge)
-
🎓 DataCamp
- Associate Data Analyst in SQL
- Associate Data Scientist in Python (in progress)
-
🎓 Datab
- Formação Completa em Power BI
- Power BI Specialist
-
🎓 Udemy
- Estatística para Análise de Dados com Python - Data Scientist. Luciano Galdino
- Álgebra Linear com Python para Machine Learning e Modelagem - Data Scientist. Luciano Galdino
- Python Data Science: Data Prep & EDA with Python - Data Scientist. Alice Zhao
- SQL para Análise de Dados - Midori Toyota
- AWS QuickSight: Dashboards Profissionais - Midori Toyota
-
🎓 LinkedIn Learning
- Fundamentos de Estatística (1,2,3) Eddie Davila
📊 Nationwide monitoring of repair operations and service performance

🔧 Tech:
- Power BI
- DAX
- Data Modeling
📈 Key Metrics:
- Mean Time to Repair (MTTR)
- Backlog of Open Requests
- SLA Compliance
- Performance by Region
💡 Highlights:
- Identification of operational bottlenecks impacting SLA performance
- Regional performance analysis
- SLA monitoring enabling faster response to delays
📊 Monitoring of telecom equipment lifecycle and service operations

🔧 Tech:
- Power BI
- DAX
- Data Modeling
📈 Key Metrics:
- Service Orders (OS)
- Installations vs Removals
- Repair Status
- Scheduling Performance
💡 Highlights:
- CPE lifecycle management
- Partner performance analysis
- Repair and scheduling tracking
- Identification of inefficiencies in equipment lifecycle and operations
🔎 View Project Details
📊 Monitoring the migration of proprietary circuits to partner providers, focusing on SLA, backlog, and operational performance.

🔧 Tech:
- Power BI
- DAX
- Data Modeling
- Power Automate
📈 Key Metrics:
- Total Service Orders (OS)
- Backlog of Open Orders
- Mean Time to Install (TMI)
- SLA Compliance
💡 Highlights:
- Migration performance by partner providers
- Backlog and delay analysis
- SLA monitoring and execution time tracking
- Geographic distribution of service orders
⚙️ Automation:
- Automated distribution of backlog OS to partner providers
- Priority-based email notifications
- End-to-end workflow automation (analysis → decision → execution)
💼 Operational Impact:
- Reduced manual workload through automation
- Improved prioritization of service orders
- Increased operational efficiency and response time
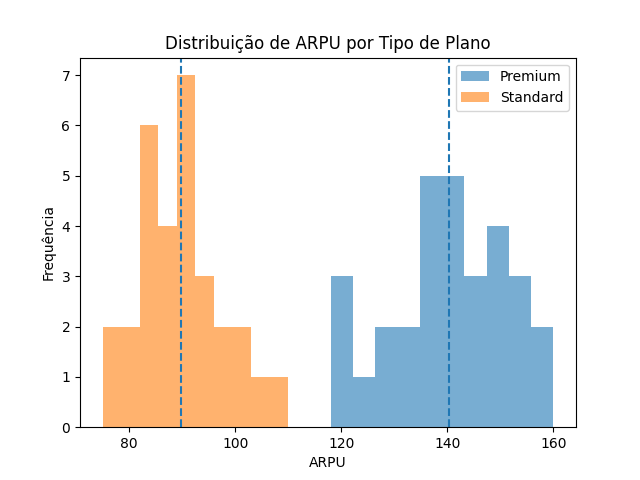
📊 Analyze whether premium customers generate higher average revenue (ARPU) compared to standard customers
💼 Business Impact:
- Supports strategic decisions on upsell and pricing
- Enables better customer segmentation based on revenue behavior
🔧 Tech:
- Python, pandas, SciPy, matplotlib
📈 Results:
- Statistically significant difference identified between premium and standard customers
- Premium segment shows higher average revenue (ARPU)
💡 Business Impact:
- Supports data-driven upsell strategies
- Helps optimize revenue and customer targeting
🤖 Automate operational analysis, SLA reporting, and email delivery using AI and prompt engineering
🔧 Tech:
- Python, Pandas
- Prompt Engineering (AI - Antigravity)
- Automation workflows
- Email automation (automated report delivery)
📈 Results:
- Automated generation of operational reports
- Automated email delivery of reports 📧
- Faster SLA analysis and decision support
- Significant reduction in manual analysis effort
💡 Business Impact:
- Improves operational efficiency
- Enables real-time and consistent reporting
- Reduces manual workload in report distribution
- Supports faster, data-driven decision-making in telecom operations
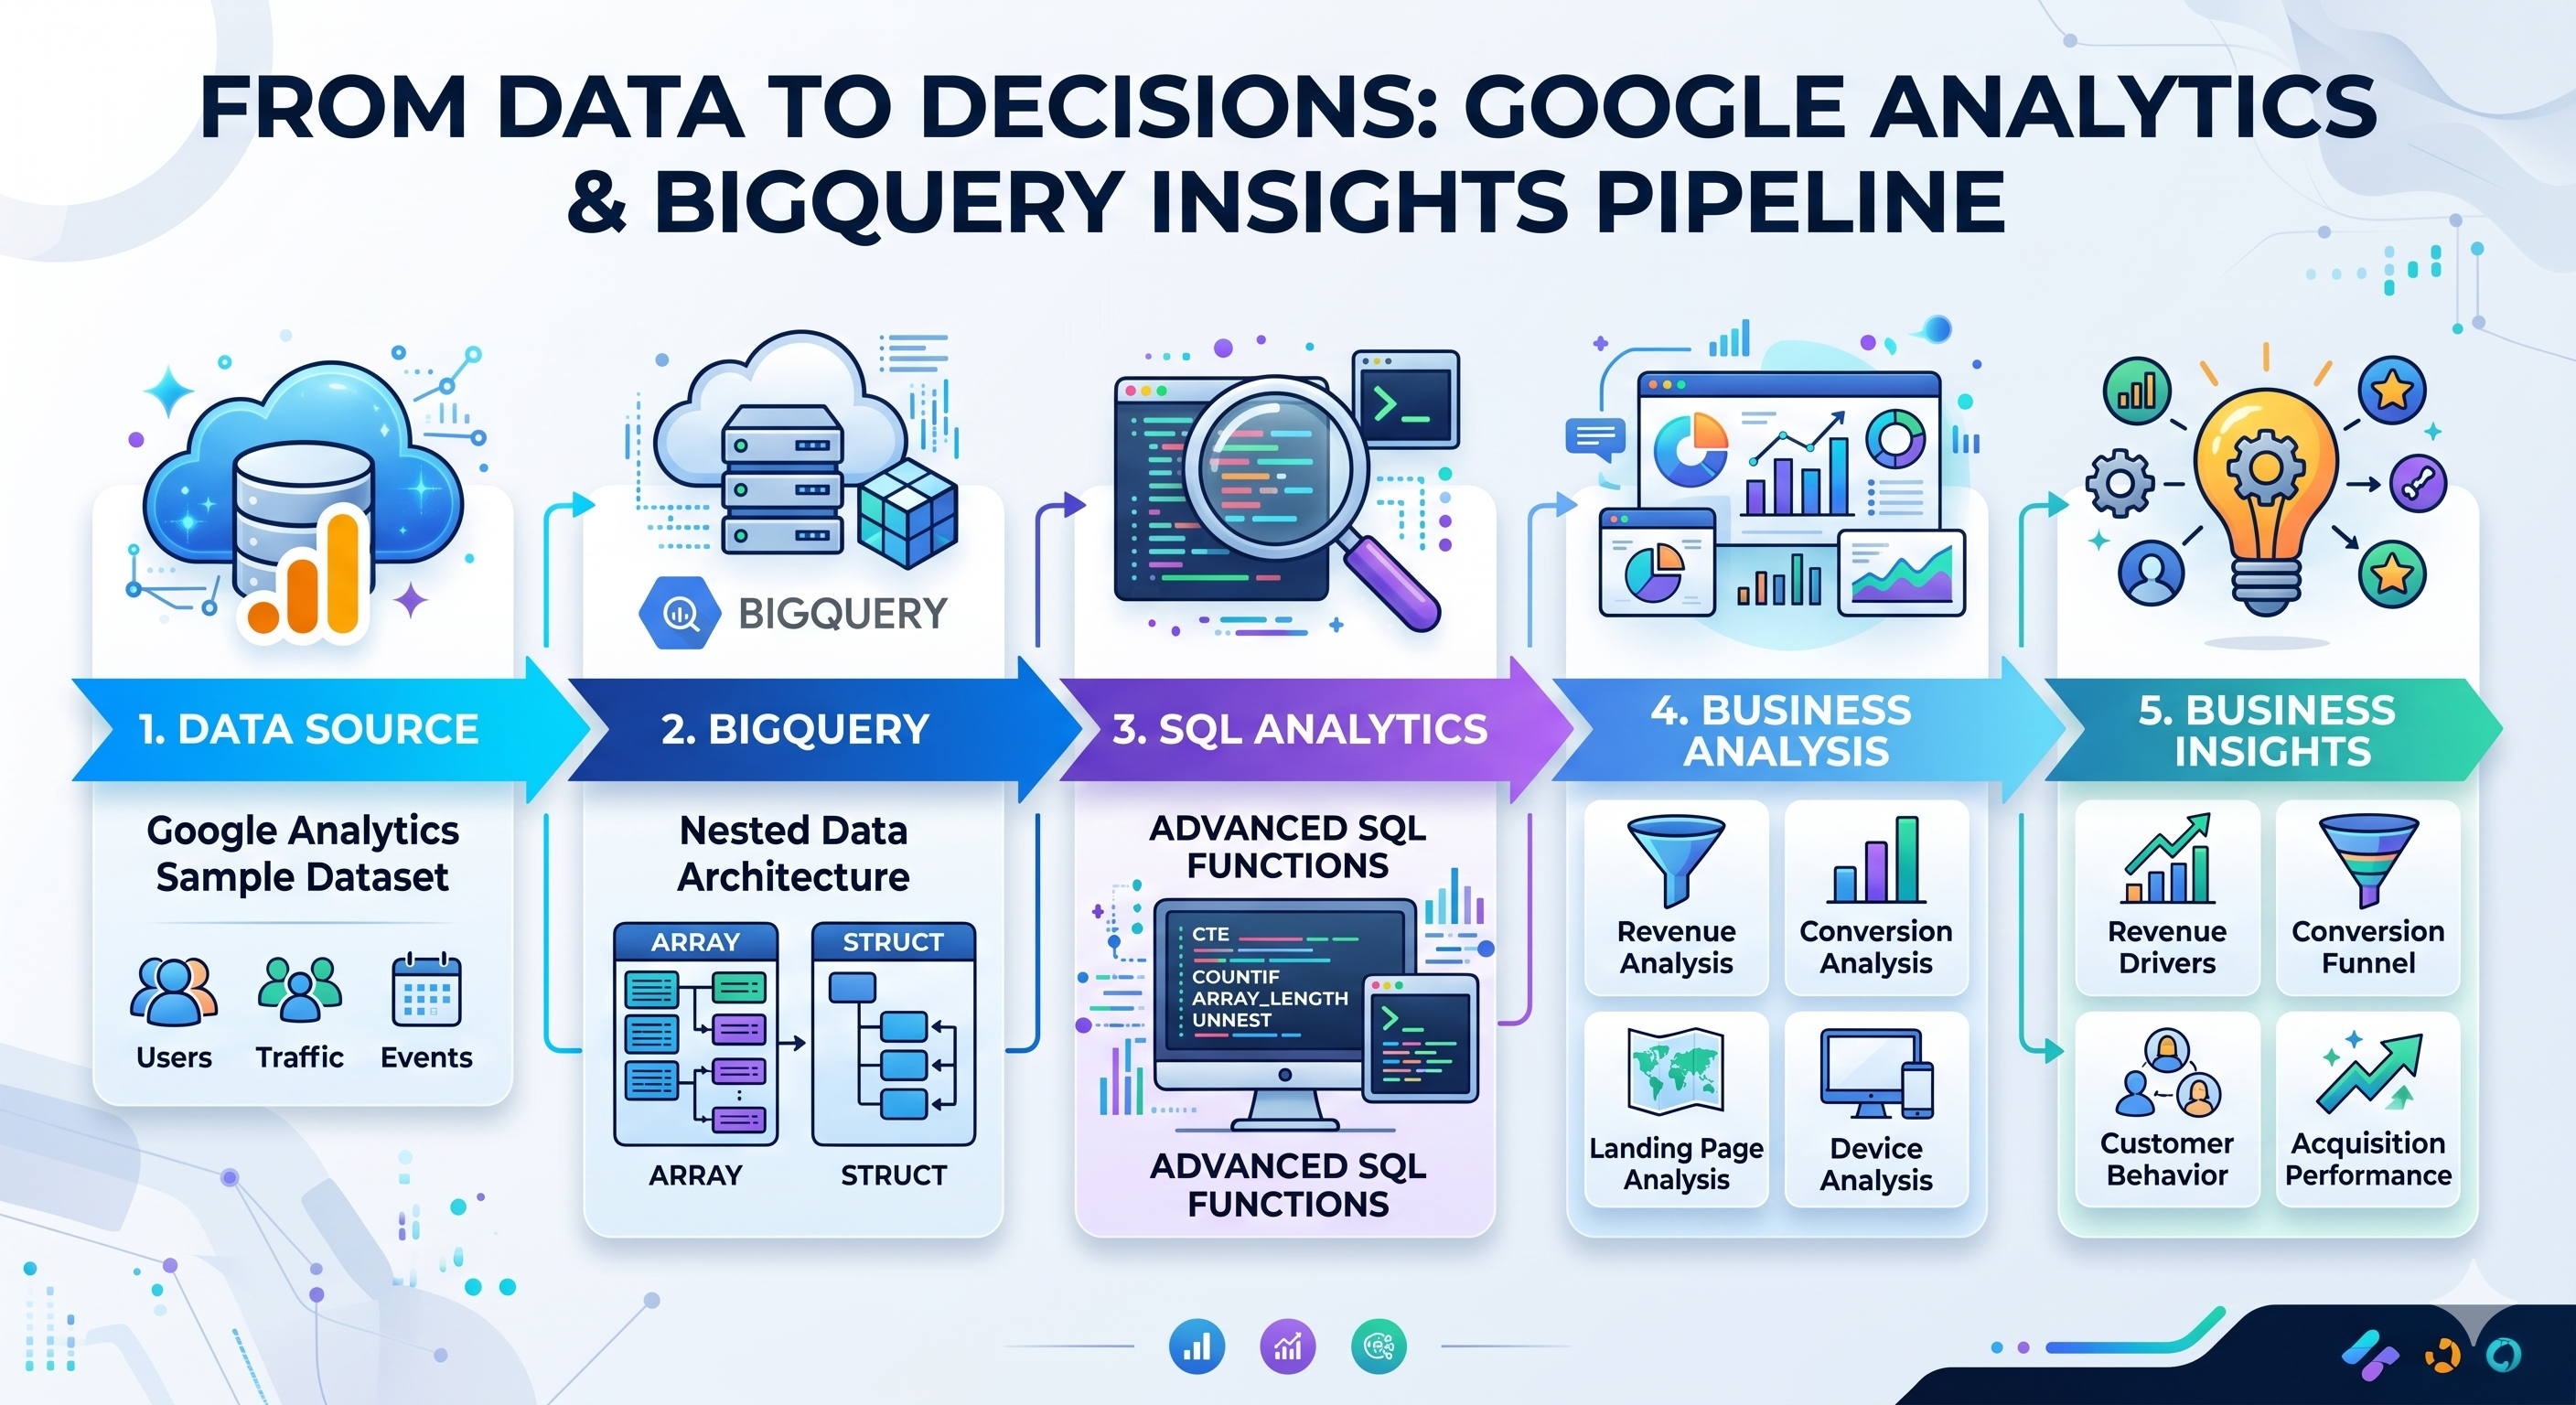
📊 Business-oriented analytics project transforming nested Google Analytics data into actionable business insights using BigQuery SQL.
🔧 Tech:
- Google BigQuery
- SQL
- ARRAY
- STRUCT
- UNNEST()
- CTEs
📈 Key Analyses:
- Revenue Analysis
- Conversion Analysis
- Landing Page Performance
- Acquisition Channel Performance
- Device Conversion Analysis
- User Engagement Analysis
💡 Highlights:
- Analysis of nested Google Analytics datasets
- Practical use of ARRAY, STRUCT and UNNEST
- Revenue attribution and conversion insights
- Business-focused analytics and storytelling
- Professional project documentation and architecture design
🏆 Business Insights:
- Referral channels achieved the highest conversion efficiency
- Homepage was the primary revenue entry point
- Desktop users generated most purchasing sessions
- Traffic volume did not necessarily translate into conversions
☁️ Modern cloud-based Business Intelligence solution using Google BigQuery and Looker Studio.
🔧 Tech:
- Google BigQuery
- Looker Studio
- SQL
- Cloud Analytics
📈 Features:
- Interactive dashboard
- KPI cards
- Cloud-based analytics
- SQL Views
- Calculated Fields
- Dynamic filters
💡 Highlights:
- Fully cloud-native BI solution
- Professional dashboard design
- BigQuery + Looker Studio integration
- Modern alternative to desktop BI tools
- SQL transformations and business rules implementation
🚚 Solução analítica completa para monitoramento operacional e financeiro de uma transportadora utilizando PostgreSQL (Neon), SQL Analytics e Looker Studio.
🔧 Tech:
- PostgreSQL (Neon)
- SQL
- Looker Studio
- GitHub
📈 Key Analyses:
- Revenue by Region
- Operational Profit by Region
- Top Drivers
- Top Destinations
- Time Series Analysis
- Operational Margin Analysis
💡 Highlights:
- 15 documented SQL analyses
- SQL Views for analytics
- Window Functions (LAG, RANK, SUM OVER)
- KPI development
- Business-focused dashboard
🏆 Business Impact:
- Identification of top-performing regions
- Operational profitability monitoring
- Driver performance analysis
- Strategic decision support
💬 Feel free to reach out — I’m open to opportunities and collaborations.
-
LinkedIn Preferred contact: Antonio Neto
-
Email (secondary): aestevao@gmail.com
To work in data-driven roles, delivering measurable business impact through analytics, automation, and machine learning.