gnuplot
Installation - Usage - Output - Resources - References
gnuplot is an open source command-line program that can generate high quality two- and three-dimensional plots of functions, data, and data fits. It is a program with a fairly long history, dating back to 1986. Despite its name, this software is not part of the GNU project.⁽¹⁾
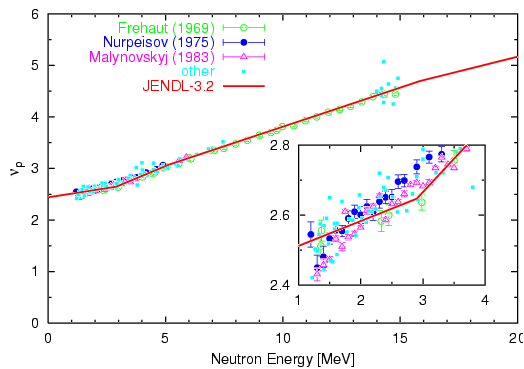
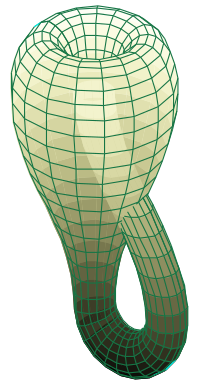
| Points and lines plot with subplot | 3D bar plot | 3D surface |
|---|---|---|
 |
 |
 |
Binaries are available for all major systems from different sources. The source code is hosted on SourceForge.
On Linux distributions and other free Unix systems, it can usually be installed with the system's package manager or software store. It is also available from Homebrew and from third parties listed in http://www.gnuplot.info/download.html.
Command to install on Debian/Ubuntu:
sudo apt install gnuplot
On macOS, it can be installed with Homebrew and MacPorts. Standalone applications are distributed by third parties listed in http://www.gnuplot.info/download.html.
Command to install with Homebrew:
brew install gnuplot
Installers for Windows are available on SourceForge. It can also be installed in Unix-like environments as Cygwin and WSL (Windows Subsystem for Linux on Windows 10). Development versions by third parties are listed in http://www.gnuplot.info/download.html.
TODO: Interactive mode, batch mode, one-liners, libraries...
A plot can be sent to an interactive window or to a file (or pipe) depending on the selected terminal.
The postscript terminal is an option for producing vector graphics, which can be rescaled without quality loss. Thought PS files are not directly used for printing nowadays, images in EPS file format are still common:
epsmode generates EPS (Encapsulated PostScript) output, which is just regular PostScript with some additional lines that allow the file to be imported into a variety of other applications. […] Inepsmode the whole plot, including the fonts, is reduced to half of the default size.⁽²⁾
The default options for eps mode in gnuplot 5.0+ results in an image size of 5 x 3.5 inches and font size of 7pt:
defaultsets all options to their defaults:landscape,monochrome,dl 1.0,lw 1.0,defaultplex,enhanced, "Helvetica" and 14pt. Default size of a PostScript plot is 10 inches wide and 7 inches high.⁽²⁾
The default PS size of 10 x 7 inches and aspect ratio of 10:7 ≃ 1.429 are close enough to the A4 paper size of 11.7 x 8.25 inches and aspect ratio of √2:1 ≃ 1.414. An EPS graph with the default size would fit nicely in the top half of an A4 paper sheet.
The minimal command for producing colored high-quality EPS files is thus:
set term postscript eps color
A complete example with options:
set terminal postscript eps color size 4,3 font "Helvetica,20" linewidth 2
Here is the full documentation in PDF for the latest version of gnuplot 5.2.
- Tutorial for gnuplot 4.2 at IBM Developer Works
- A brief gnuplot tutorial by Henri Gavin
- Introduction to gnuplot and Not so FAQ and Solutions: in English and Japanese by Dr. T. Kawano
- gnuplot or, How To Make Your Data Look Neat and Shiny– slides by Ron Ho
Gnuplot page in Portuguese:
- Tutorial: introdução ao uso do aplicativo gnuplot by prof. Mauricio Galo
Gnuplot book on Library Genesis: http://gen.lib.rus.ec/search.php?&req=gnuplot+in+action&sort=year&sortmode=DESC
Cheat Sheets on repository: https://github.com/amphybio/main/tree/master/documents/gnuplot
- Wikipedia - https://en.wikipedia.org/wiki/Gnuplot
- Gnuplot 5.2 full documentation - http://www.gnuplot.info/docs_5.2/Gnuplot_5.2.pdf