Local, privacy-first usage dashboard for AI coding CLIs. Track tokens, cost, and prompt-caching savings across Claude Code and OpenAI Codex CLI in a single browser tab — without sending a byte to anyone.


npx ccgaugeOne command. ccgauge reads the JSONL session files Claude Code and Codex CLI already write to your disk, computes per-day / per-project / per-model token usage and dollar-equivalent cost, then opens a unified web dashboard in your browser. Switch between data sources with one click. No login, no telemetry, no network calls.
If you pay per token on the API, or sit on a Claude Pro / Max / Team / Codex Plus subscription, you've probably wondered:
- "How much would Claude Code have cost me on the API this month?"
- "Is prompt caching actually saving me money — and how much?"
- "Which project / session / model is eating the most tokens?"
- "How close am I to the 5-hour rate-limit window resetting?"
The terminal-based ccusage is great for printing tables. ccgauge gives you the same data plus charts, drill-down, a live 5-hour block countdown — and it's the unified dashboard for both Claude Code and OpenAI Codex CLI side by side.
Everything runs locally as a Next.js app. Your conversation transcripts never leave the machine.
- One dashboard for both Claude Code and OpenAI Codex CLI, plus an All view that merges the two
- Toggle data source from the nav bar (Claude · Codex · All), each button rendered with the real provider logo; URL persists via
?source=, last choice cached in cookie - Worktree-aware Projects — all worktrees of the same repo collapse into a single project row
- Built-in provider adapter layer (
lib/providers/) — adding a third CLI (Gemini CLI, Cursor, Aider, …) is one new file plus a single registry line
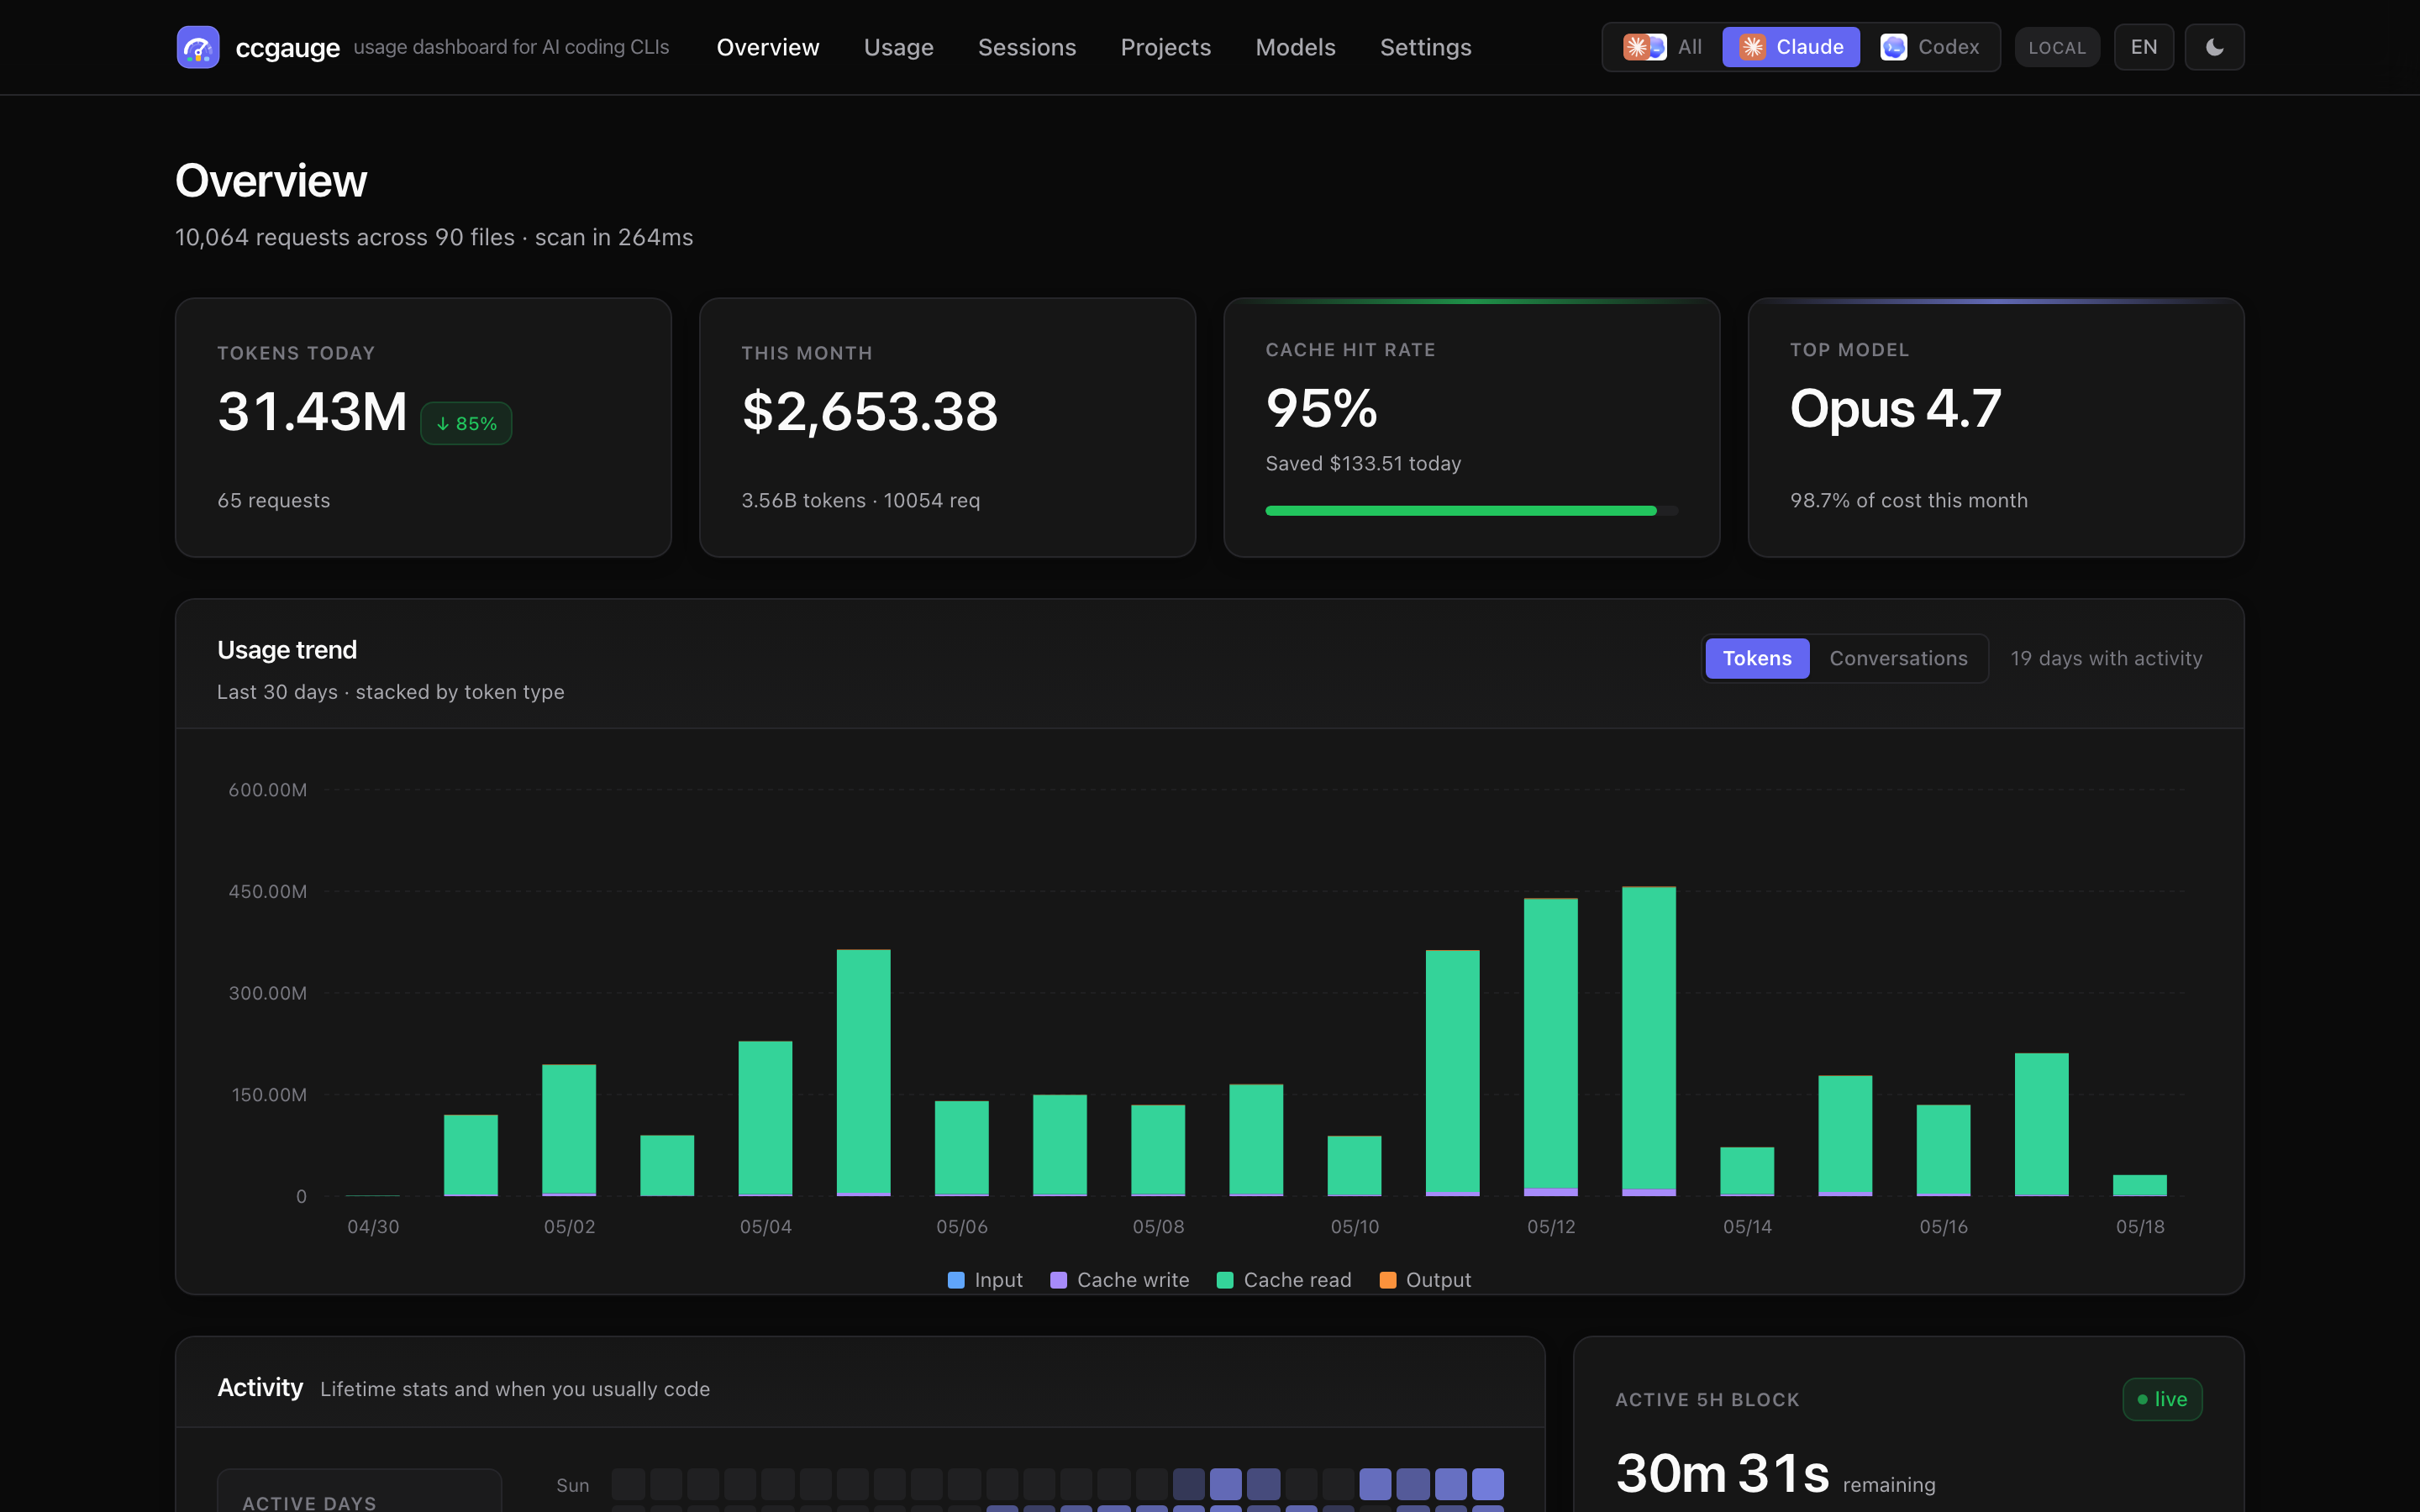
- Tokens today, cost today, this month, cache hit rate, top model, active sessions
- Day-over-day delta on every card (
vs yesterday) - Live 5-hour block — countdown, progress bar, burn-rate per minute, projected total cost
- Sessions — per-conversation list with model / tokens / cost / duration, plus a message-level timeline
- Projects — per-
cwdaggregation cards with sparkline and spend share - Models — side-by-side comparison: cost share, tokens share, cache hit, USD pricing
- Usage — turn-grouped table with expandable tool-call breakdown, CSV export. Tokens / Conversations toggle on the trend chart so you can count rows the way the usage table counts them
- Cache savings is its own KPI — quantifies how much Anthropic prompt caching saved you vs. paying full input price
- Codex cost shown as the OpenAI API equivalent so subscription users can compare value against pay-as-you-go
- Built-in pricing tables: 12 Claude models + the gpt-5 family + o-series; unknown models fall back to family-latest
- Light / Dark / System themes, no flash of incorrect theme
- English / 中文 (cookie + localStorage)
- Filters: time range (today / 7d / 30d / 90d / all), granularity (hour / day / week / month), model and project multi-select
ccgauge reportprints a colored, aligned terminal usage report in ~0.2 s from the same JSONL the dashboard reads--range / --source / --by / --since / --until / --model / --projectfilters--jsonfor machine-readable output;--no-colorauto-applied when piped — drops cleanly into shell scripts and CI
ccgauge mcpruns a stdio JSON-RPC server so Claude Desktop / Cursor / Cline can query your local usage directly- Nine MCP tools:
usage_summary,usage_by_time,usage_by_model,usage_by_project,usage_by_session,daily_summary,weekly_summary,recent_activity,cost_estimator - Reasoning-token breakdown surfaced for the models that emit one
- Separate named cache (
index-mcp-v2.json) so MCP runs don't contend with the dashboard
- 100 % local: read-only access to existing JSONL files, zero outbound network calls
- Open source, MIT-licensed
- Background mode for a quiet always-on service, with
start / stop / restart / status / open / logslifecycle commands
Zero-install one-shot:
npx ccgaugeOr install globally:
npm  i -g ccgauge && ccgauge          # npm
pnpm i -g ccgauge && ccgauge          # pnpm
yarn global add ccgauge && ccgauge    # yarn
The dashboard opens at http://localhost:3737. If 3737 is taken, ccgauge falls back to the next free port automatically. Press Ctrl+C to stop.
Requirements: Node.js 20+ (Node 22 recommended for pnpm test). Works on macOS, Linux, and Windows.
ccgauge is shorthand for ccgauge start, so flags work after either command.
ccgauge
ccgauge --port 4000 --no-open
ccgauge start --host 0.0.0.0 --port 4000ccgauge start --background
ccgauge status
ccgauge open
ccgauge logs # last 80 lines
ccgauge logs --follow # tail in real time
ccgauge restart --port 4000
ccgauge stopBackground mode persists state under ~/.ccgauge/:
state.json— PID, URL, start time, log file pathccgauge.log— server output (read byccgauge logs)- Override with
CCGAUGE_STATE_DIR=/path/to/dirfor isolated profiles or tests
| Command | Purpose |
|---|---|
ccgauge, ccgauge start |
Start in foreground. Ctrl+C to stop. |
ccgauge start --background |
Start a detached background service. |
ccgauge stop [--force] |
Stop the background service. |
ccgauge restart [options] |
Stop and re-start with new options. |
ccgauge status [--json] |
Inspect the background service. |
ccgauge open |
Open the running dashboard in your browser. |
ccgauge logs [-f] [-n <lines>] |
Print background-service log file (the server's stdout). |
ccgauge report [options] |
Print a formatted usage report to stdout (one-shot, no server). |
ccgauge mcp |
Start the MCP server on stdio so LLMs can query usage. |
A no-server one-shot summary that reads the same JSONL files the dashboard does and prints a colored, aligned report:
ccgauge report                       # last 7d, all sources, top 10 models
ccgauge report -r 30d -b project     # 30 days, broken down by project
ccgauge report -s codex -m gpt-5.5   # only codex, only gpt-5.5*
ccgauge report --json                # JSON output for scripting
ccgauge report --since 2026-05-01 --until 2026-05-08
Report options:
| Option | Default | Purpose |
|---|---|---|
-r, --range <range> |
7d |
today / 1d / 7d / 30d / 90d / all |
-s, --source <provider> |
all |
claude / codex / all |
-b, --by <dim> |
model |
Breakdown dimension: model / project / session |
-g, --gran <granularity> |
day |
Trend bucket: hour / day / week / month |
-n, --limit <n> |
10 |
Rows in the breakdown table |
--since <date> |
— | Override range start (ISO date or YYYY-MM-DD) |
--until <date> |
— | Override range end |
-m, --model <pat> |
— | Filter records whose model contains <pat> |
--project <pat> |
— | Filter by project basename / cwd substring |
-j, --json |
off | Machine-readable JSON instead of formatted text |
--no-color |
— | Disable ANSI colors (auto-disabled when piped) |
--no-trend |
— | Skip the trend chart |
--no-breakdown |
— | Skip the breakdown table |
Date-only --since/--until values use local calendar-day boundaries, so
--until 2026-05-08 includes all of May 8.
The name
report(notlogs) avoids clashing withccgauge logs, which tails the background server's stdout log file.
| Option | Applies to | Purpose |
|---|---|---|
-p, --port <port> |
start, restart, root | Preferred port. Default: 3737. |
-H, --host <host> |
start, restart, root | Bind host. Default: 127.0.0.1. |
--no-open |
start, root | Skip auto-open in foreground mode. (Background mode never auto-opens; use ccgauge open instead.) |
--dir <path> |
start, restart, root | Add <path>/projects as a Claude data source. |
-q, --quiet |
start, restart, root | Silence Next.js output. |
-b, --background |
start, root | Run as a detached background service. |
--strict-port |
start, restart, root | Fail if the preferred port is busy. |
--log <path> |
start --background, restart | Background log file path. |
ccgauge ships an Model Context Protocol server so any MCP-aware client (Claude Desktop, Cursor, Cline, Codex CLI, your own agent…) can talk to your local Claude Code + Codex CLI history through structured tools — no copy-paste, no screenshots of the dashboard.
Once configured, you can ask things like:
- "How much did I spend on AI coding this week? Break it down by Claude vs Codex."
- "What did I work on yesterday?"
- "Show me my 10 most expensive sessions this month."
- "Which project ate the most tokens in the last 30 days?"
- "Was prompt caching saving me money? How much?"
- "Estimate the cost of 100K input + 20K output on Opus 4.7."
- "How big was my Codex reasoning overhead last week?"
- "Give me a weekly stand-up bullet list of what I shipped."
The LLM picks the right tool, calls it locally, and answers in plain English with real numbers from your machine.
| Tool | What it answers |
|---|---|
usage_summary |
Total tokens / cost / cache savings for a date range. Always returns combined totals + per-source breakdown. |
usage_by_time |
Time-series buckets (hour / day / week / month) for trend questions. |
usage_by_model |
Per-model cost share. Each entry tagged with its source. |
usage_by_project |
Per-project (cwd) cost share + session counts + last-activity. |
usage_by_session |
Session list with title (= first user message), models, duration, cost. Sort by recent / cost / tokens / duration. |
daily_summary |
"What did I do today / yesterday / Monday / on YYYY-MM-DD?" Sessions grouped by project + models + top tool calls. |
weekly_summary |
7-day roll-up: per-day cost trend, top sessions, top projects, models. week_offset=-1 for last week. |
recent_activity |
The N most recently active sessions across providers. |
cost_estimator |
Compute the USD cost of a hypothetical request ({ source, model, input_tokens, output_tokens, cache_* }). Uses built-in per-1M-token pricing; does NOT consult usage history. |
| Resource URI | Content |
|---|---|
ccgauge://providers |
Detected providers, data dirs, file/record counts, indexer status. |
Common arguments (every analytical tool accepts these):
source:"claude"|"codex"|"all"(default"all"). When"all", the response carries combined totals and abySource: { claude, codex }breakdown so the LLM can answer either combined or provider-specific questions in a single call.- Date range: pass
range(one oftoday,yesterday,this_week,last_week,this_month,last_month,7d,30d,90d,all) or explicitfrom/to(ISO date or full timestamp).
The exact config-file location depends on your client; the snippet shape is the same.
~/Library/Application Support/Claude/claude_desktop_config.json (macOS) /
%APPDATA%\Claude\claude_desktop_config.json (Windows):
{
  "mcpServers": {
    "ccgauge": {
      "command": "npx",
      "args": ["-y", "ccgauge", "mcp"]
    }
  }
}
If you've installed ccgauge globally (npm i -g ccgauge), drop the npx:
{
  "mcpServers": {
    "ccgauge": {
      "command": "ccgauge",
      "args": ["mcp"]
    }
  }
}
Restart Claude Desktop. The 8 ccgauge tools appear in the tool picker.
~/.cursor/mcp.json (project-level: <project>/.cursor/mcp.json):
{
  "mcpServers": {
    "ccgauge": {
      "command": "ccgauge",
      "args": ["mcp"]
    }
  }
}Anything that follows the standard { command, args, env? } shape works.
Use either npx -y ccgauge mcp (no global install) or ccgauge mcp
(with global install). To override scan paths, pass them via env:
{
  "mcpServers": {
    "ccgauge": {
      "command": "ccgauge",
      "args": ["mcp"],
      "env": {
        "CCGAUGE_CODEX_DIR": "/custom/codex/path",
        "CLAUDE_CONFIG_DIR": "/custom/claude/path",
        "CCGAUGE_STATE_DIR": "/custom/cache/path"
      }
    }
  }
}In Claude Desktop, open a new chat and ask:
"What ccgauge tools do you have? Run usage_summary for the last 7 days."
You should see Claude pick usage_summary, return a JSON payload with
totals + bySource, then summarise it in prose with real numbers.
Drop these into Claude Desktop / Cursor / Cline as-is. The italics next to each one are the tool(s) the LLM will pick — useful if you want to debug "why did it answer X".
- "How much did I spend on AI coding this week, broken down by Claude and Codex?"
→
usage_summary({ range: "7d" }) - "What's my AI coding cost this month? How does that compare to last month?"
→
usage_summary({ range: "this_month" })+usage_summary({ range: "last_month" }) - "Show me a daily cost trend for the last 30 days."
→
usage_by_time({ range: "30d", granularity: "day" }) - "Which Claude model did I use the most this month, and how much did it cost?"
→
usage_by_model({ range: "this_month", source: "claude" }) - "Top 5 most expensive sessions this month?"
→
usage_by_session({ range: "this_month", sort: "cost", limit: 5 })
- "What did I work on yesterday? Group by project."
→
daily_summary({ date: "yesterday" }) - "Generate a Monday stand-up bullet list of what I shipped last week."
→
weekly_summary({ week_offset: -1 }) - "Which 3 projects have I touched most in the last two weeks?"
→
usage_by_project({ from: "2026-05-01", to: "2026-05-15", limit: 3 })— pass explicitfrom/tofor any window not covered by the named ranges (7d/30d/90d/this_week/last_week/ …). - "What was my last coding session about?"
→
recent_activity({ limit: 1 })
- "How many tokens did Anthropic prompt caching save me this month?"
→
usage_summary({ range: "this_month", source: "claude" })— the response includessaved_usd. - "What percentage of my Codex output is reasoning tokens this week?"
→
usage_summary({ range: "7d", source: "codex" })— response carriesreasoning_tokensnext tooutput_tokens.
- "At my current burn rate, how much will I spend this month?"
→
usage_summary({ range: "this_month" })+usage_by_time({ range: "this_month", granularity: "day" })— LLM extrapolates. - "If I run another 200K input + 50K output on Opus 4.7 today, what does that add to my month-to-date cost?"
→
cost_estimator({ source: "claude", model: "claude-opus-4-7", input_tokens: 200000, output_tokens: 50000 })+usage_summary({ range: "this_month" })— the estimator returns the dollar cost for the hypothetical request without touching your usage history.
- "Am I getting more value out of Claude or Codex this month, by tokens-per-dollar?"
→
usage_summary({ range: "this_month" })— both totals are inbySource. - "For each provider, which project ate the most tokens last week?"
→
usage_by_project({ range: "last_week" })(each entry already carriessource).
- stdio only in v1 — no network ports, no remote access
- Reads only the JSONL files you already have on disk; no upstream API calls
- Absolute paths in error messages are scrubbed (
$HOME→~) - The MCP server uses a separate persisted cache (
~/.ccgauge/cache/index-mcp-v2.json) so it never fights the dashboard for the same on-disk state file
| Symptom | Try |
|---|---|
| Client doesn't see ccgauge tools | Restart the client after editing the config; check npx -y ccgauge mcp runs in your shell |
| First call is slow | First call after a cold start indexes all JSONL files (~1–3 s for 100 files); subsequent calls are O(1) |
| "no providers detected" in the resource | The MCP process can't see ~/.claude/projects / ~/.codex/sessions; pass CLAUDE_CONFIG_DIR / CCGAUGE_CODEX_DIR via env in the MCP config |
| Want to see what the server is logging | Watch the client's MCP log; ccgauge writes to stderr (stdout is reserved for JSON-RPC) |
ccgauge auto-detects the standard locations:
| Provider | Default sources |
|---|---|
| Claude Code | ~/.claude/projects, ~/.config/claude/projects |
| OpenAI Codex CLI | ~/.codex/sessions, ~/.codex/archived_sessions |
Override or extend via environment variables:
| Variable | Effect |
|---|---|
CCGAUGE_CONFIG_DIR |
Add <dir>/projects as a Claude data source |
CLAUDE_CONFIG_DIR |
Same as above (Claude Code 1.0.30+ compatible) |
CCGAUGE_CODEX_DIR |
Add an extra Codex sessions directory |
CODEX_HOME |
Add <dir>/sessions and <dir>/archived_sessions |
CCGAUGE_STATE_DIR |
Override background service state/log directory |
~/.claude/projects/**/*.jsonl  ──┐
                                 ├─►  ProviderAdapter registry
~/.codex/sessions/**/*.jsonl  ───┘    │
                                      ▼
                              scanAll() ─► dedup ─► aggregate by
                                                    time / model / project / session / 5h block
                                                ▼
                                  Next.js RSC pages + client charts
- CLI (
bin/cli.mjs) normalizes flags, validates the standalone build, picks a port viaget-port. - Foreground uses
fork()and binds to your terminal; background uses detachedspawn()with state in~/.ccgauge/. - Provider adapters (
lib/providers/<name>/index.ts) own data dirs, JSONL parser, pricing table, and model-name formatter. The registry-driven design means adding a third provider is one file plus one registry line. - Claude parser reads each line as a typed event, extracts
usagefrom assistant messages. - Codex parser uses a turn state machine, emits one record per
event_msg.token_countfromlast_token_usage(avoids cumulative double-counting), foldscached_input_tokensinto cache-read andreasoning_output_tokensinto output. - Pricing ships built-in snapshots — Anthropic published rates for Claude (12 models) and OpenAI public rates for Codex (gpt-5 family + o-series). Codex cost is labelled "API equivalent" because subscription plans (Plus, Pro) bill differently.
- i18n + theme is cookie-driven SSR with a no-flash inline script in
<head>andlocalStoragemirror.
lib/providers/<name>/
  index.ts             ProviderAdapter implementation
  parse-<name>.ts      JSONL → AssistantRecord[]
  pricing.ts           model → Pricing
  shorten-model.ts     pretty model names
Register one line in lib/providers/index.ts, add the id to the ProviderId union, and you're done. scan.ts, the aggregator, the pricing module, and every page need no changes.
This repo is a working Next.js project — run the dashboard against your live data while iterating.
git clone https://github.com/chengzuopeng/ccgauge.git
cd ccgauge
pnpm install
pnpm dev               # http://localhost:3738
Scripts:
pnpm typecheck         # tsc --noEmit
pnpm lint              # eslint .
pnpm test              # codex parser smoke test (Node 22+)
pnpm build             # next build + copy static into .next/standalone
pnpm start             # run bin/cli.mjs against the standalone build
pnpm screenshots       # regenerate docs/screenshots/*.png
pnpm site:dev          # marketing site dev server, http://localhost:4321
pnpm site:build        # build only the site/ marketing site
pnpm clean             # rm -rf .next node_modules
Publish:
pnpm pack              # preview the tarball
pnpm publish --access public # runs `pnpm build` first via prepublishOnly| Symptom | Try |
|---|---|
| Port keeps drifting | ccgauge --strict-port --port 3737 |
| Stale background service | ccgauge status, then ccgauge stop --force |
| Background didn't start | ccgauge logs reads ~/.ccgauge/ccgauge.log |
| Need an isolated profile | CCGAUGE_STATE_DIR=/tmp/ccgauge-test ccgauge start -b |
| No data shown for Codex | Ensure ~/.codex/sessions exists; check the Settings page for detected paths |
| Want to bypass auto-open | ccgauge --no-open |
Does ccgauge upload my conversations or transcripts? No. ccgauge runs entirely on your machine. It only reads the JSONL files Claude Code and Codex CLI already store locally. There are zero outbound network calls.
How is this different from ccusage? ccusage is a terminal CLI that prints usage tables. ccgauge is a polished web dashboard with charts, per-session drill-down, a 5-hour rate-limit countdown, project / model breakdowns, and also covers OpenAI Codex CLI out of the box.
Does it work for Claude Pro / Max / Team / Codex Plus subscribers? Yes. The dashboard always reports the API-equivalent dollar value of your usage so you can see "how much would this have cost on PAYG". Subscription plans bill differently; ccgauge is not your invoice.
Which models / providers are supported?
- Claude Code: all
claude-*models (Opus / Sonnet / Haiku, 3.x and 4.x) - OpenAI Codex CLI: gpt-5 family (gpt-5, gpt-5-mini, gpt-5-nano, gpt-5.4, gpt-5.5, gpt-5.5-mini, gpt-5.5-nano), gpt-4.1 / gpt-4.1-mini, plus o-series (o3, o4-mini)
- Unknown models fall back to family-latest pricing automatically
Can I add my own provider? Yes — see Adding a provider. The provider adapter layer is the explicit extension point.
Does it require Anthropic or OpenAI credentials? No. ccgauge never calls upstream APIs. It reads the local JSONL transcripts those CLIs already write.
claude code dashboard · claude code usage · claude code cost tracker · claude code analytics ·
codex cli usage · codex cli dashboard · openai codex usage · openai codex tracker ·
ai cli token tracker · ai coding assistant cost · claude pro plan usage monitor ·
claude max plan tracker · codex plus plan usage · prompt caching savings dashboard ·
5-hour block tracker · rate limit window monitor · ccusage alternative · ccusage web ui ·
token usage analytics · agentic coding stats · local ai usage monitor · self-hosted ai dashboard
MIT — see LICENSE.