




Interactive SVG map of Nepal with all 77 districts and 7 provinces for React. Zero dependencies.
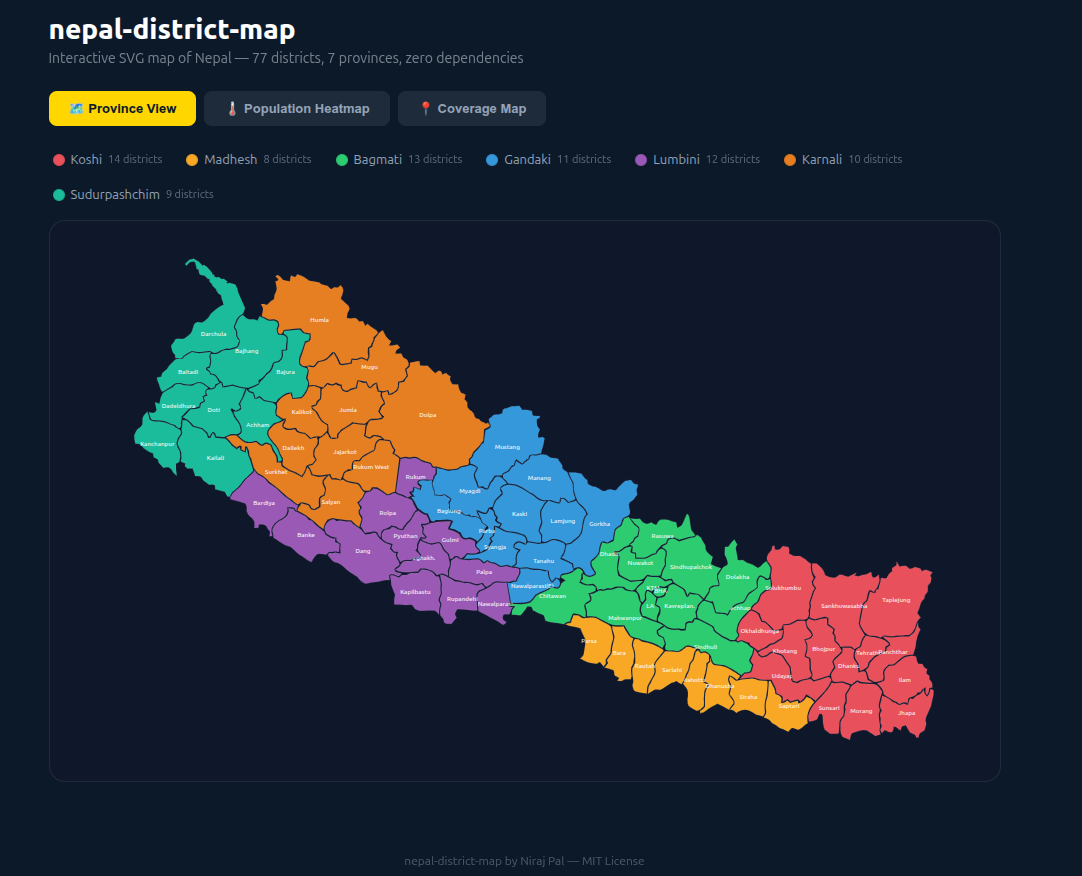
demo-screencast.mp4
- ✅ All 77 districts with accurate SVG boundaries
- ✅ Correct Darchula boundary (Limpiyadhura-Kalapani-Lipulekh territory)
- ✅ Province coloring, flat coloring, or data-driven choropleth
- ✅ Built-in hover tooltips with custom render support
- ✅ Touch & mobile support (Pointer Events)
- ✅ Click handlers and keyboard navigation (accessible)
- ✅ Province filtering with
selectedProvinceprop - ✅ Programmatic highlighting via
highlightedDistrictsprop - ✅ Configurable tooltip position — including follow-cursor mode
- ✅ Color scale utilities — linear and multi-stop gradients
- ✅ Companion
<NepalMapLegend>component - ✅ Raw SVG data export for fully custom rendering
- ✅ Full TypeScript support
- ✅ Zero runtime dependencies (React peer dep only)
- ✅ Works with Next.js, Vite, Remix, CRA
npm install nepal-district-mapimport { NepalMap } from "nepal-district-map";
function App() {
return (
<NepalMap
colorMode="province"
onDistrictClick={(name) => console.log(name)}
/>
);
}Visualize sales, revenue, or performance data across Nepal's districts. Color each district based on a metric — instantly see which regions are performing and which need attention.
import { NepalMap, createMultiColorScale, getDataStats } from "nepal-district-map";

const salesData = {
  Kathmandu: { value: 450000, tooltip: "Sales: Rs. 4.5L" },
  Pokhara: { value: 210000, tooltip: "Sales: Rs. 2.1L" },
  Butwal: { value: 180000, tooltip: "Sales: Rs. 1.8L" },
  // ... all districts
};

const stats = getDataStats(salesData);
const scale = createMultiColorScale(stats.min, stats.max, ["#dc2626", "#eab308", "#22c55e"]);

<NepalMap
  data={salesData}
  colorMode="data"
  colorScale={scale}
  backgroundColor="#0f172a"
  onDistrictClick={(name, data) => openDistrictReport(name, data)}
/>Show your distribution network — mark distributor hubs and covered areas. Perfect for FMCG, logistics, telecom, and retail companies operating across Nepal.
import { NepalMap, NepalMapLegend } from "nepal-district-map";

const network = {
  Kathmandu: { color: "#FFD600", tooltip: "📍 Main Hub" },
  Lalitpur:  { color: "#3b82f6", tooltip: "✓ Covered" },
  Bhaktapur: { color: "#3b82f6", tooltip: "✓ Covered" },
  Kaski:     { color: "#FFD600", tooltip: "📍 Regional Hub" },
  Baglung:   { color: "#3b82f6", tooltip: "✓ Covered by Kaski" },
};

<NepalMapLegend
  mode="custom"
  items={[
    { color: "#FFD600", label: "Distributor Hub" },
    { color: "#3b82f6", label: "Covered District" },
    { color: "#1a2744", label: "Expansion Opportunity" },
  ]}
/>
<NepalMap
  data={network}
  colorMode="flat"
  baseColor="#1a2744"
  backgroundColor="#0B2A4A"
/>Display election results, vote share, or party presence by district. Use province filtering to drill into specific regions.
import { NepalMap } from "nepal-district-map";

const results = {
  Kathmandu: { color: "#dc2626", tooltip: "Party A — 62%" },
  Kaski:     { color: "#2563eb", tooltip: "Party B — 55%" },
  Surkhet:   { color: "#16a34a", tooltip: "Party C — 48%" },
  // ...
};

<NepalMap data={results} colorMode="flat" baseColor="#334155" />Map health indicators, vaccination coverage, disaster impact zones, or program reach across districts. Ideal for NGOs, government agencies, and research institutions.
import { NepalMap, createColorScale } from "nepal-district-map";

const vaccinationRate = {
  Kathmandu:  { value: 94, tooltip: "Vaccination: 94%" },
  Humla:      { value: 41, tooltip: "Vaccination: 41%" },
  Dolpa:      { value: 38, tooltip: "Vaccination: 38%" },
  // ...
};

const scale = createColorScale(0, 100, "#dc2626", "#16a34a"); // red → green

<NepalMap
  data={vaccinationRate}
  colorMode="data"
  colorScale={scale}
  renderTooltip={(name, data) => (
    <div>
      <strong>{name}</strong>
      <p style={{ color: "#86efac" }}>{data?.tooltip}</p>
    </div>
  )}
/>Visualize literacy rates, school enrollment, or research survey data across Nepal's districts and provinces.
import { NepalMap, getProvinceSummary } from "nepal-district-map";

const literacyData = {
  Kathmandu: { value: 91.7 },
  Humla:     { value: 47.2 },
  // ...
};

// Get province-level summary for a sidebar
const summary = getProvinceSummary(literacyData);Embed an interactive map in news articles, letting readers explore data by district — weather events, economic indicators, infrastructure projects.
Display project status, budget allocation, or service coverage across districts. Province filter lets users focus on their region.
import { NepalMap, NepalMapLegend } from "nepal-district-map";
import { useState } from "react";
import type { Province } from "nepal-district-map";

function GovernmentDashboard() {
  const [province, setProvince] = useState<Province | null>(null);

  return (
    <>
      <NepalMapLegend
        selectedProvince={province}
        onProvinceClick={(p) => setProvince(province === p ? null : p)}
      />
      <NepalMap
        selectedProvince={province}
        data={projectStatusData}
        colorMode="flat"
        onDistrictClick={(name) => router.push(`/district/${name}`)}
      />
    </>
  );
}Show delivery availability, shipping zones, or estimated delivery times by district.
const deliveryZones = {
  Kathmandu: { color: "#22c55e", tooltip: "Same day delivery" },
  Pokhara:   { color: "#22c55e", tooltip: "Same day delivery" },
  Butwal:    { color: "#eab308", tooltip: "Next day delivery" },
  Dhangadhi: { color: "#f97316", tooltip: "2–3 days" },
  Humla:     { color: "#dc2626", tooltip: "5–7 days" },
};

<NepalMap data={deliveryZones} colorMode="flat" baseColor="#1e293b" />import { NepalMap, NepalMapLegend } from "nepal-district-map";
import { useState } from "react";
import type { Province } from "nepal-district-map";
function FilterableMap() {
const [selected, setSelected] = useState<Province | null>(null);
return (
<div>
<NepalMapLegend
selectedProvince={selected}
onProvinceClick={(p) => setSelected(selected === p ? null : p)}
/>
<NepalMap selectedProvince={selected} />
</div>
);
}<NepalMap
renderTooltip={(name, data) => (
<div>
<strong>{name}</strong>
{data?.value && <p>Value: {data.value.toLocaleString()}</p>}
</div>
)}
/>Highlight districts matching a search query:
import { NepalMap, DISTRICT_NAMES } from "nepal-district-map";
import { useState, useMemo } from "react";

function SearchableMap() {
  const [query, setQuery] = useState("");

  const matches = useMemo(
    () => DISTRICT_NAMES.filter(d => d.toLowerCase().includes(query.toLowerCase())),
    [query]
  );

  return (
    <>
      <input value={query} onChange={e => setQuery(e.target.value)} placeholder="Search district..." />
      <NepalMap
        highlightedDistricts={query ? matches : []}
        highlightColor="#22c55e"
      />
    </>
  );
}<NepalMap tooltipPosition="follow-cursor" /><NepalMap
data={salesData}
colorMode="data"
valueFormatter={(v) => `Rs. ${v.toLocaleString("en-NP")}`}
/>Mark districts as unavailable (e.g. no data, restricted access):
const data = {
  Kathmandu: { value: 100 },
  Mustang:   { disabled: true, tooltip: "No data available" },
  Manang:    { disabled: true, tooltip: "No data available" },
};

<NepalMap data={data} onDistrictClick={(name) => console.log(name)} /><NepalMap data={data} disabled />import { DISTRICTS, DISTRICT_PROVINCE, PROVINCES } from "nepal-district-map/data";
<svg viewBox="0 0 1200 800">
{DISTRICTS.map(d => (
<path key={d.id} d={d.d} fill={myColorFn(d.name)} />
))}
</svg>import {
getDistrictsByProvince,
getProvinceByDistrict,
getDataStats,
getProvinceSummary,
createColorScale,
createMultiColorScale,
getTotalDistricts,
} from "nepal-district-map";
getDistrictsByProvince("Bagmati");
// → ["Dolakha", "Sindhupalchok", "Ramechhap", ...]
getProvinceByDistrict("Kathmandu");
// → "Bagmati"
getTotalDistricts();
// → 77
const stats = getDataStats(myData);
// → { min, max, count, total, average }
const summary = getProvinceSummary(myData);
// → [{ province, color, totalDistricts, coveredDistricts, totalValue }, ...]| Prop | Type | Default | Description |
|---|---|---|---|
data |
DistrictDataMap |
— | Data to visualize. Keys are district names |
colorMode |
"province" | "flat" | "data" |
"province" |
How to color districts |
baseColor |
string |
"#e2e8f0" |
Fill color for flat mode or uncovered districts |
strokeColor |
string |
"#94a3b8" |
Border color |
strokeWidth |
number |
0.5 |
Border width |
hoverColor |
string |
"#FFD600" |
Stroke color on hover |
backgroundColor |
string |
"transparent" |
Container background |
showLabels |
boolean |
true |
Show district name labels |
labelFontSize |
number |
9 |
Label font size |
labelColor |
string |
"rgba(255,255,255,0.9)" |
Label color |
showTooltip |
boolean |
true |
Show tooltip on hover |
renderTooltip |
(name, data?) => ReactNode |
— | Custom tooltip renderer |
onDistrictClick |
(name, data?) => void |
— | Click handler |
onDistrictHover |
(name | null) => void |
— | Hover handler |
selectedProvince |
Province | null |
null |
Highlight one province |
provinceColors |
Record<Province, {fill, stroke}> |
— | Override province colors |
shortNames |
Record<string, string> |
— | Short labels for small districts |
colorScale |
(value: number) => string |
— | Color function for data mode |
className |
string |
— | CSS class for container |
style |
CSSProperties |
— | Inline styles for container |
maxHeight |
string |
"560px" |
Max SVG height |
viewBox |
string |
"0 0 1200 800" |
SVG viewBox |
ariaLabel |
string |
"Interactive map of Nepal" |
Accessible label |
dimOpacity |
number |
0.2 |
Opacity for non-selected provinces |
transitionDuration |
number |
200 |
Animation duration in ms (0 to disable) |
tooltipPosition |
TooltipPosition |
"top-right" |
"top-left" | "top-right" | "bottom-left" | "bottom-right" | "follow-cursor" |
valueFormatter |
(value: number) => string |
— | Format numeric values in the default tooltip |
highlightedDistricts |
string[] |
— | Programmatically highlight districts (e.g. search results) |
highlightColor |
string |
"#FFD600" |
Stroke color for highlighted districts |
disabled |
boolean |
false |
View-only mode — disables all interactions |
| Prop | Type | Default | Description |
|---|---|---|---|
mode |
"province" | "custom" |
"province" |
Legend mode |
items |
LegendItem[] |
— | Custom items (for custom mode) |
direction |
"horizontal" | "vertical" |
"horizontal" |
Layout direction |
swatchShape |
"circle" | "square" |
"circle" |
Swatch shape |
swatchSize |
number |
12 |
Swatch size in px |
fontSize |
number |
12 |
Label font size |
labelColor |
string |
"#64748b" |
Label color |
selectedProvince |
Province | null |
— | Highlights matching item |
onProvinceClick |
(province: Province) => void |
— | Province click handler |
className |
string |
— | CSS class |
style |
CSSProperties |
— | Inline styles |
renderItem |
(item, index) => ReactNode |
— | Custom item renderer |
type Province =
  | "Koshi" | "Madhesh" | "Bagmati" | "Gandaki"
  | "Lumbini" | "Karnali" | "Sudurpashchim";

interface DistrictData {
  value?: number;         // Numeric value for choropleth
  color?: string;         // Override fill color
  tooltip?: string;       // Tooltip text
  disabled?: boolean;     // Disable this specific district
  [key: string]: unknown; // Any extra metadata
}

type DistrictDataMap = Record<string, DistrictData>;

interface DistrictPath {
  id: string;   // Unique kebab-case id
  name: string; // Display name
  d: string;    // SVG path data
  cx: number;   // Label center X (viewBox 0–1200)
  cy: number;   // Label center Y (viewBox 0–800)
}

interface LegendItem {
  color: string;
  label: string;
  value?: string | number;
}| Province | Districts | Count |
|---|---|---|
| Koshi | Taplejung, Panchthar, Ilam, Jhapa, Morang, Sunsari, Dhankuta, Tehrathum, Sankhuwasabha, Bhojpur, Solukhumbu, Okhaldhunga, Khotang, Udayapur | 14 |
| Madhesh | Saptari, Siraha, Dhanusha, Mahottari, Sarlahi, Rautahat, Bara, Parsa | 8 |
| Bagmati | Dolakha, Sindhupalchok, Ramechhap, Sindhuli, Kavrepalanchok, Bhaktapur, Lalitpur, Kathmandu, Nuwakot, Rasuwa, Dhading, Makwanpur, Chitawan | 13 |
| Gandaki | Manang, Mustang, Myagdi, Kaski, Lamjung, Gorkha, Tanahu, Syangja, Parbat, Baglung, Nawalparasi East | 11 |
| Lumbini | Nawalparasi, Rupandehi, Kapilbastu, Palpa, Arghakhanchi, Gulmi, Pyuthan, Rolpa, Dang, Banke, Bardiya, Rukum | 12 |
| Karnali | Dolpa, Mugu, Humla, Jumla, Kalikot, Dailekh, Jajarkot, Surkhet, Salyan, Rukum West | 10 |
| Sudurpashchim | Bajura, Bajhang, Darchula, Baitadi, Dadeldhura, Doti, Achham, Kailali, Kanchanpur | 9 |
- SVG has
role="img"andaria-label - Each district has
aria-labelwith name, province, and data context - Interactive districts are keyboard-focusable (
tabIndex={0}) - Enter/Space triggers click on focused districts
- Tooltip uses
role="tooltip"andaria-live="polite"
All modern browsers — Chrome, Firefox, Safari, Edge. IE11 not supported.
Read CHANGELOG.md for complete release history.
I would love to have your contributions. Please check the Contributing Guide for guidelines.
Niraj Pal
- 🌐 Website: nirajpal.com.np
- 🐙 GitHub: @palniraj
- 💼 LinkedIn: niraj-pal
- 🔧 Upwork: nirajpal
MIT © 2025 Niraj Pal