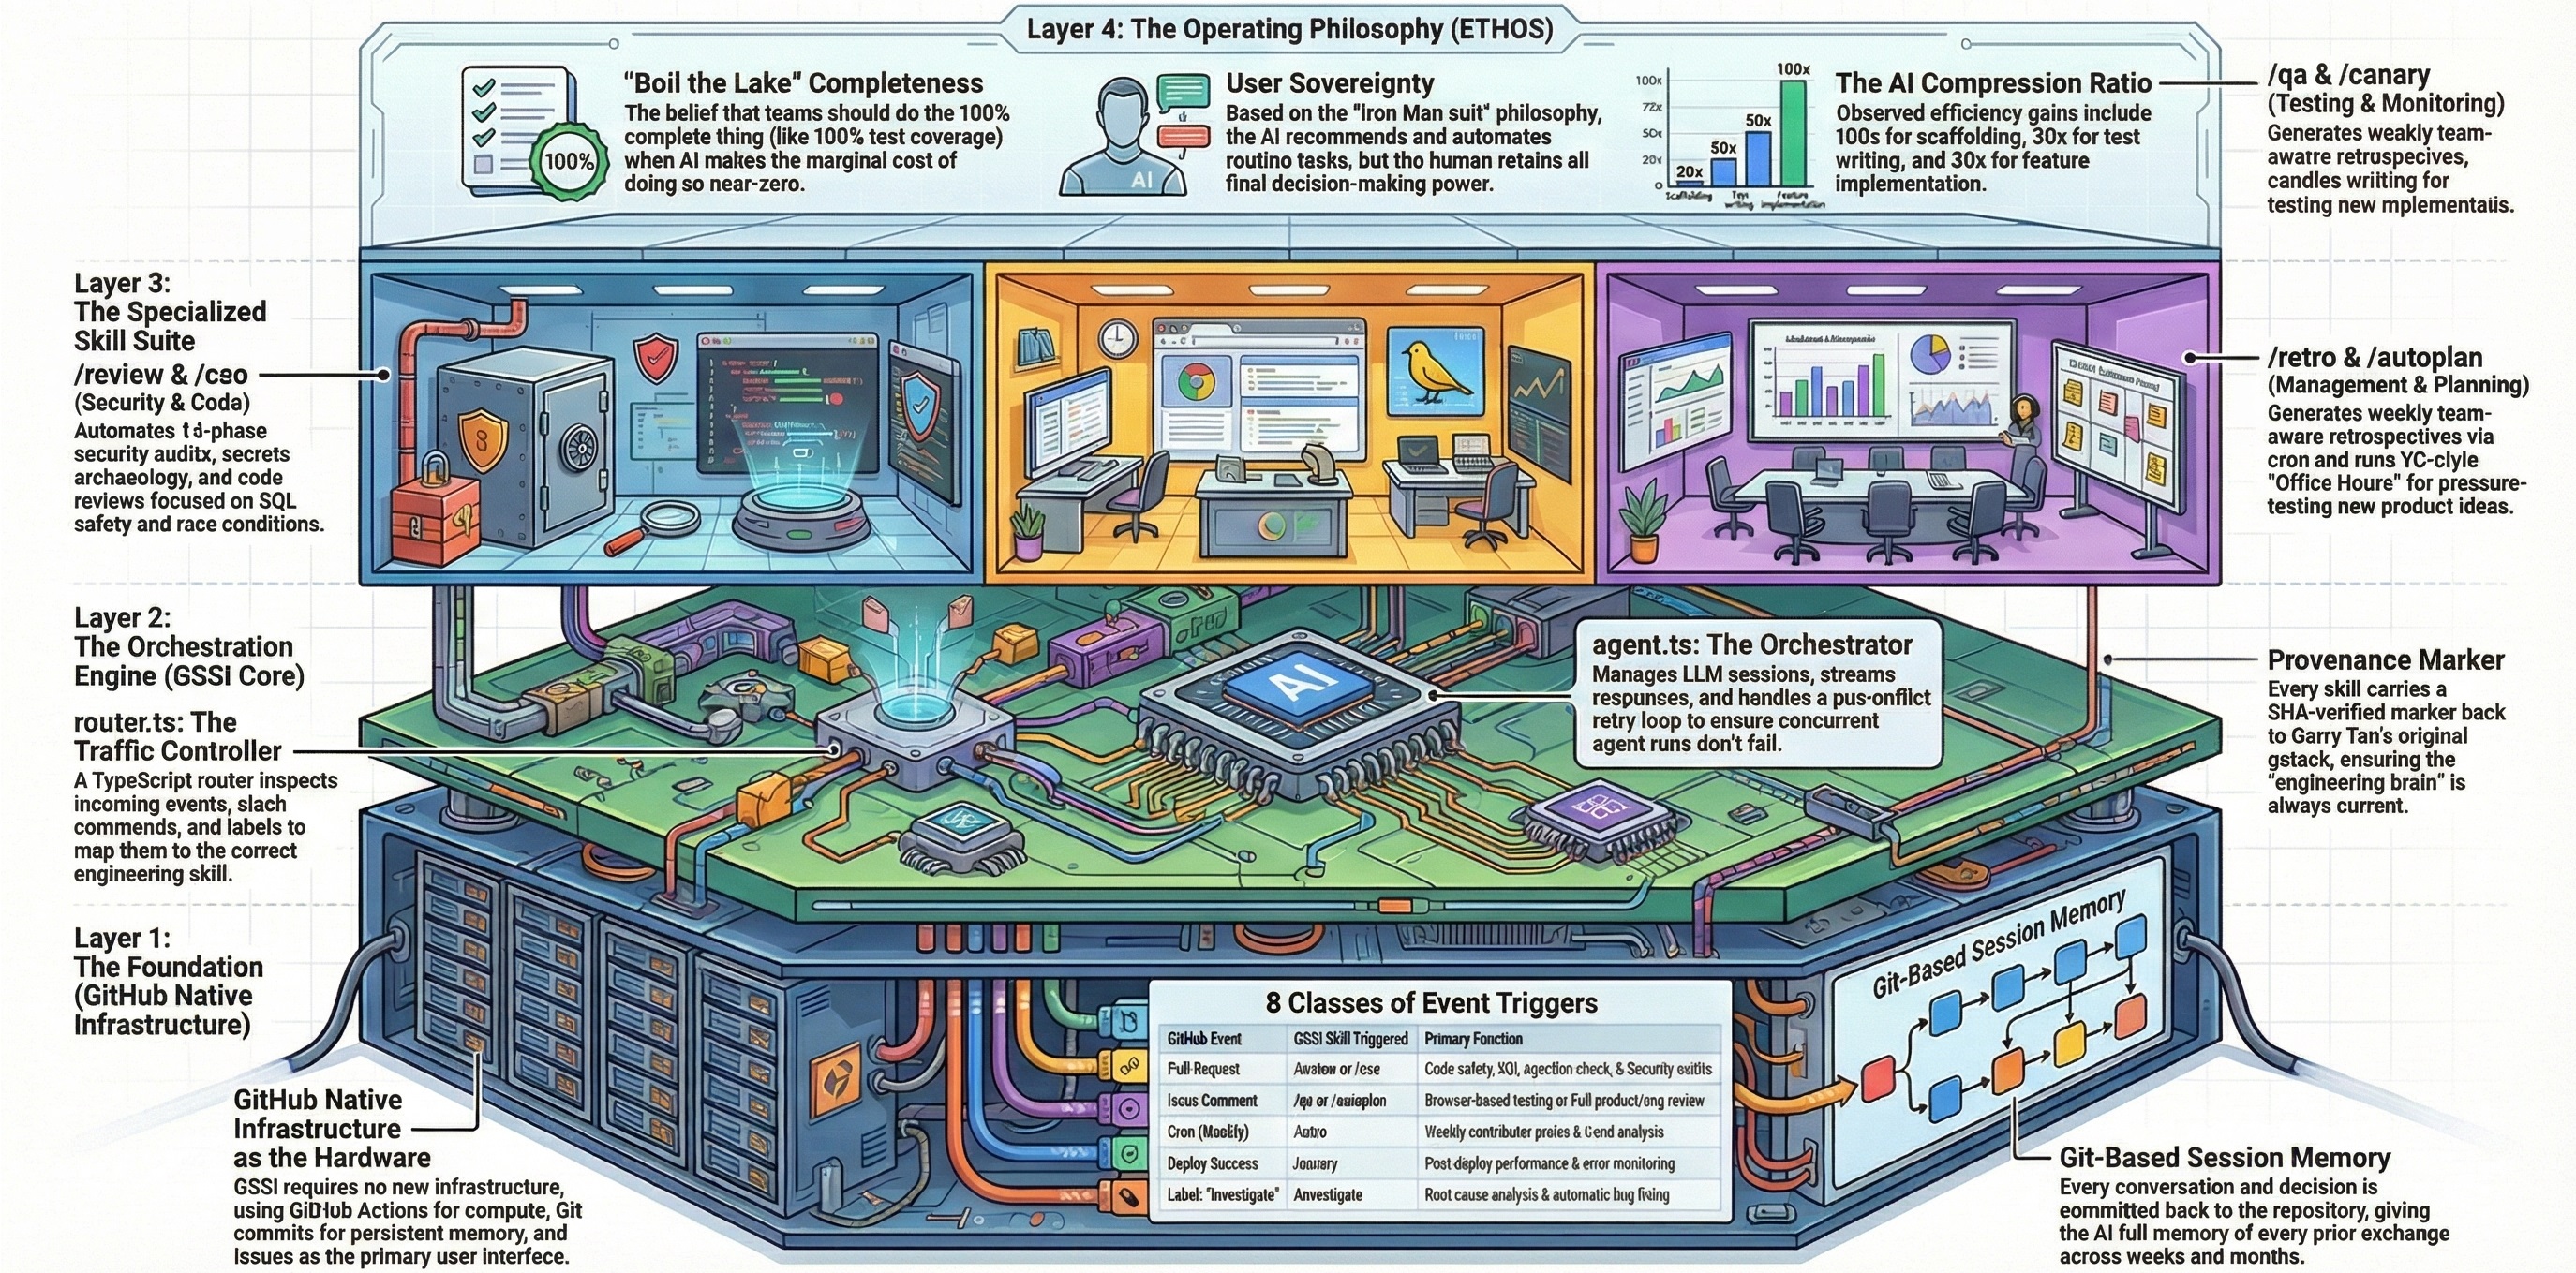
Post-deploy visual monitoring that watches the live app for console errors, performance regressions, and page failures — the safety net between "shipped" and "verified."
| Property | Value |
|---|---|
| Trigger | Automatic on deployment_status event (when status is success); also /canary <url> on an issue |
| Browser Required | ✅ Yes (Playwright Chromium) |
| Default State | ❌ Disabled |
| Results Path | state/results/canary/{timestamp}.json |
Comment on an issue:
/canary https://myapp.com
| Command | Description |
|---|---|
/canary <url> |
Monitor a URL for 10 minutes after deploy |
/canary <url> --duration 5m |
Custom monitoring duration (1m to 30m) |
/canary <url> --baseline |
Capture baseline screenshots (run BEFORE deploying) |
/canary <url> --pages /,/dashboard,/settings |
Specify pages to monitor |
/canary <url> --quick |
Single-pass health check (no continuous monitoring) |
- Before deploying: Run
/canary <url> --baselineto capture the current production state - Deploy your changes
- After deploying: Run
/canary <url>to monitor production for anomalies - After healthy monitoring: Update the baseline to reflect the new production state
The /canary skill acts as a Release Reliability Engineer, watching production after a deploy. It catches issues that pass CI but break in production — missing environment variables, stale CDN caches, slow database migrations on real data.
Creates canary report directories for reports, baselines, and screenshots. Parses user arguments — default duration is 10 minutes.
Captures the current state BEFORE deploying:
- Screenshots of each page
- Console error counts
- Page load times from
perf - Text content snapshots
Saves a baseline.json manifest and tells the user: "Baseline captured. Deploy your changes, then run /canary <url> to monitor."
If no --pages were specified, auto-discovers pages by navigating to the URL and extracting the top 5 internal navigation links. Presents the discovered pages for confirmation with options to add more or monitor homepage only.
If no baseline exists, takes a quick snapshot as a reference point before starting the monitoring loop. Records console error count and load time for each page.
Monitors every 60 seconds for the specified duration. Each check:
- Navigates to each page
- Takes a screenshot
- Captures console errors
- Records performance metrics
After each check, compares against the baseline or pre-deploy snapshot:
| Alert Level | Condition |
|---|---|
| 🔴 CRITICAL | Page load failure — goto returns error or timeout |
| 🟠 HIGH | New console errors not present in baseline |
| 🟡 MEDIUM | Performance regression — load time exceeds 2× baseline |
| 🔵 LOW | Broken links — new 404s not in baseline |
Key principles:
- Alert on changes, not absolutes. A page with 3 console errors in the baseline is fine if it still has 3. One NEW error is an alert.
- Transient tolerance. Only alerts on patterns persistent across 2+ consecutive checks. A single network blip is not an alert.
When a CRITICAL or HIGH alert fires, the user is notified immediately with evidence (screenshot path, baseline vs. current values) and options: Investigate now, Continue monitoring, Rollback, or Dismiss.
After monitoring completes, produces a summary with:
- Overall status: HEALTHY, DEGRADED, or BROKEN
- Per-page results with status, error counts, and average load times
- Total alerts fired by severity
- Screenshot paths for evidence
- Final verdict on deploy health
If the deploy is healthy, offers to update the baseline with current screenshots so future canary runs compare against the new production state.
CANARY REPORT — https://myapp.com
═════════════════════════════════
Duration:     10 minutes
Pages:        3 pages monitored
Checks:       30 total checks performed (10 per page)
Status:       DEGRADED

Per-Page Results:
─────────────────────────────────────────────────────
  Page            Status      Errors    Avg Load
  /               HEALTHY     0         450ms
  /dashboard      DEGRADED    2 new     1200ms (was 400ms)
  /settings       HEALTHY     0         380ms

Alerts Fired:  3 (0 critical, 1 high, 2 medium)
Screenshots:   .github-gstack-intelligence/state/local/canary-reports/screenshots/

Alert Details:
  [HIGH] /dashboard — 2 new console errors detected at check #3 (180s)
    Error: "TypeError: Cannot read property 'user' of undefined"
    Error: "Failed to fetch /api/v2/preferences (404)"
  [MEDIUM] /dashboard — load time 3x baseline (400ms → 1200ms) at checks #4-10

VERDICT: DEPLOY HAS ISSUES — /dashboard showing new errors and performance regression.
         Console errors suggest a missing API endpoint or auth state issue.
In config.json:
{
  "canary": {
    "enabled": false,
    "trigger": "deployment_status"
  }
}| Field | Type | Description |
|---|---|---|
enabled |
boolean |
Set to true to enable — disabled by default |
trigger |
string |
deployment_status fires automatically when a deployment succeeds; also responds to issue_comment slash commands |
Automatic trigger details: The router only fires /canary when event.deployment_status.state === "success". The monitored URL is extracted from event.deployment.environment_url or event.deployment_status.target_url.
| Requirement | Details |
|---|---|
| Browser | ✅ Required — Playwright Chromium (npx playwright install chromium) |
| Model | Default model from config (gpt-5.4) recommended |
| Permissions | admin, maintain, or write on the repository |
| Tools | Bash, Read, Write, Glob |
| Target | A running, accessible web application |
| Duration | Default 10 minutes; configurable 1–30 minutes |
Reports are saved in both Markdown and JSON formats:
.github-gstack-intelligence/state/local/canary-reports/{date}-canary.md
.github-gstack-intelligence/state/local/canary-reports/{date}-canary.json
All screenshots (baselines, pre-deploy snapshots, and monitoring captures) are stored in:
.github-gstack-intelligence/state/local/canary-reports/screenshots/
.github-gstack-intelligence/state/local/canary-reports/baselines/
A structured JSONL entry is appended for the review dashboard:
{
  "skill": "canary",
  "timestamp": "<ISO>",
  "status": "HEALTHY|DEGRADED|BROKEN",
  "url": "<monitored-url>",
  "duration_min": 10,
  "alerts": 3
}- Speed matters. Starts monitoring within 30 seconds of invocation.
- Alert on changes, not absolutes. Compares against baseline, not industry standards.
- Screenshots are evidence. Every alert includes a screenshot path — no exceptions.
- Transient tolerance. Only alerts on patterns persistent across 2+ consecutive checks to avoid false alarms.
- Baseline is king. Without a baseline, canary is a health check. Always encourage
--baselinebefore deploying. - Performance thresholds are relative. 2× baseline is a regression; 1.5× might be normal variance.
- Read-only. Observes and reports — does not modify code unless the user explicitly asks to investigate and fix.
| File | Purpose |
|---|---|
skills/canary.md |
Skill prompt definition |
config.json |
Skill enablement and trigger configuration |
lifecycle/router.ts |
Event routing — maps deployment_status events and /canary slash commands |
/benchmark— Performance regression detection (pre-deploy complement to canary)/qa— Quality assurance testing with browser automation