Performance regression detection using browser automation to establish baselines for page load times, Core Web Vitals, and resource sizes.
| Property | Value |
|---|---|
| Trigger | Scheduled — 0 6 * * * (daily at 6 AM UTC); also /benchmark on an issue |
| Browser Required | ✅ Yes (Playwright Chromium) |
| Default State | ❌ Disabled |
| Results Path | state/benchmarks/history/{date}.json |
Comment on an issue:
/benchmark <url>
| Command | Description |
|---|---|
/benchmark <url> |
Full performance audit with baseline comparison |
/benchmark <url> --baseline |
Capture baseline (run before making changes) |
/benchmark <url> --quick |
Single-pass timing check (no baseline needed) |
/benchmark <url> --pages /,/dashboard,/api/health |
Specify pages to benchmark |
/benchmark --diff |
Benchmark only pages affected by current branch |
/benchmark --trend |
Show performance trends from historical data |
- Before changes: Run
/benchmark <url> --baselineto capture the current state - After changes: Run
/benchmark <url>to compare against the baseline - Over time: Run
/benchmark --trendto visualize performance trends
The /benchmark skill acts as a Performance Engineer, measuring real browser metrics to catch the thousand paper cuts that slowly degrade app performance.
Creates the benchmark report directories and sets up the project slug for file organization.
Auto-discovers pages from navigation, or uses pages specified with --pages. In --diff mode, benchmarks only pages affected by the current branch by analyzing the git diff.
For each page, navigates with Playwright and collects comprehensive metrics via performance.getEntries():
Timing Metrics:
- TTFB (Time to First Byte):
responseStart - requestStart - FCP (First Contentful Paint): from paint entries
- LCP (Largest Contentful Paint): from PerformanceObserver
- DOM Interactive:
domInteractive - navigationStart - DOM Complete:
domComplete - navigationStart - Full Load:
loadEventEnd - navigationStart
Resource Analysis:
- Top 15 slowest resources with name, type, transfer size, and duration
- JS bundle sizes (all
<script>resources) - CSS bundle sizes (all stylesheet resources)
- Network summary: total requests, total transfer, breakdown by initiator type
In --baseline mode, saves all collected metrics to a structured JSON file at .github-gstack-intelligence/state/local/benchmark-reports/baselines/baseline.json. The baseline includes per-page timing metrics, request counts, transfer sizes, and largest resources.
If a baseline exists, compares current metrics against it with color-coded status indicators:
Regression Thresholds:
| Category | WARNING | REGRESSION |
|---|---|---|
| Timing metrics | >20% increase | >50% increase OR >500ms absolute increase |
| Bundle size | >10% increase | >25% increase |
| Request count | >30% increase | — |
Each regression includes a diagnostic hint (e.g., "LCP doubled — likely a large new image or blocking resource").
Lists the top 10 slowest resources with actionable recommendations:
- Large bundles → suggest code-splitting
- Third-party scripts → suggest async/defer loading
- Large images → suggest lazy loading, width/height attributes
Checks against industry-standard budgets:
| Metric | Budget |
|---|---|
| FCP | < 1.8s |
| LCP | < 2.5s |
| Total JS | < 500KB |
| Total CSS | < 100KB |
| Total Transfer | < 2MB |
| HTTP Requests | < 50 |
Produces an overall grade (A–F) based on passing/failing budget checks.
In --trend mode, loads historical baseline files and shows performance trends across the last 5+ benchmarks, including FCP, LCP, bundle size, request count, and grade over time. Flags concerning trends (e.g., "LCP doubled in 8 days", "JS bundle growing 50KB/week").
Writes the full report to both Markdown and JSON formats at .github-gstack-intelligence/state/local/benchmark-reports/{date}-benchmark.{md,json}.
PERFORMANCE REPORT — https://myapp.com
══════════════════════════════════════
Branch: feature/new-dashboard vs baseline (main)

Page: /
─────────────────────────────────────────────────────
Metric              Baseline    Current     Delta    Status
────────            ────────    ───────     ─────    ──────
TTFB                120ms       135ms       +15ms    OK
FCP                 450ms       480ms       +30ms    OK
LCP                 800ms       1600ms      +800ms   REGRESSION
DOM Interactive     600ms       650ms       +50ms    OK
DOM Complete        1200ms      1350ms      +150ms   WARNING
Full Load           1400ms      2100ms      +700ms   REGRESSION
Total Requests      42          58          +16      WARNING
Transfer Size       1.2MB       1.8MB       +0.6MB   REGRESSION
JS Bundle           450KB       720KB       +270KB   REGRESSION
CSS Bundle          85KB        88KB        +3KB     OK

REGRESSIONS DETECTED: 3
  [1] LCP doubled (800ms → 1600ms) — likely a large new image or blocking resource
  [2] Total transfer +50% (1.2MB → 1.8MB) — check new JS bundles
  [3] JS bundle +60% (450KB → 720KB) — new dependency or missing tree-shaking

PERFORMANCE BUDGET CHECK
════════════════════════
Metric              Budget      Actual      Status
────────            ──────      ──────      ──────
FCP                 < 1.8s      0.48s       PASS
LCP                 < 2.5s      1.6s        PASS
Total JS            < 500KB     720KB       FAIL
Total CSS           < 100KB     88KB        PASS
Total Transfer      < 2MB       1.8MB       WARNING (90%)
HTTP Requests       < 50        58          FAIL

Grade: B (4/6 passing)
In config.json:
{
  "benchmark": {
    "enabled": false,
    "trigger": "schedule",
    "schedule": "0 6 * * *"
  }
}| Field | Type | Description |
|---|---|---|
enabled |
boolean |
Set to true to enable — disabled by default |
trigger |
string |
schedule for cron-based invocation; also responds to issue_comment slash commands |
schedule |
string |
Cron expression — 0 6 * * * = daily at 6 AM UTC |
| Requirement | Details |
|---|---|
| Browser | ✅ Required — Playwright Chromium (npx playwright install chromium) |
| Model | Default model from config (gpt-5.4) recommended |
| Permissions | admin, maintain, or write on the repository |
| Tools | Bash, Read, Write, Glob |
| Target | A running web application accessible via URL |
Reports are saved in both Markdown and JSON formats:
.github-gstack-intelligence/state/local/benchmark-reports/{date}-benchmark.md
.github-gstack-intelligence/state/local/benchmark-reports/{date}-benchmark.json
Baselines for comparison are stored at:
.github-gstack-intelligence/state/local/benchmark-reports/baselines/baseline.json
Each baseline includes per-page metrics: TTFB, FCP, LCP, DOM interactive/complete, full load time, total requests, transfer bytes, JS/CSS bundle sizes, and the top largest resources.
- Measure, don't guess. Uses actual
performance.getEntries()data, not estimates. - Baseline is essential. Without a baseline, absolute numbers are reported but regressions can't be detected.
- Relative thresholds, not absolute. 2000ms is fine for a complex dashboard, terrible for a landing page. Always compares against YOUR baseline.
- Third-party scripts are context. Flags them, but focuses recommendations on first-party resources the team can fix.
- Bundle size is the leading indicator. Load time varies with network; bundle size is deterministic.
- Read-only. Produces the report but does not modify code unless explicitly asked.
| File | Purpose |
|---|---|
skills/benchmark.md |
Skill prompt definition |
config.json |
Skill enablement, trigger, and schedule configuration |
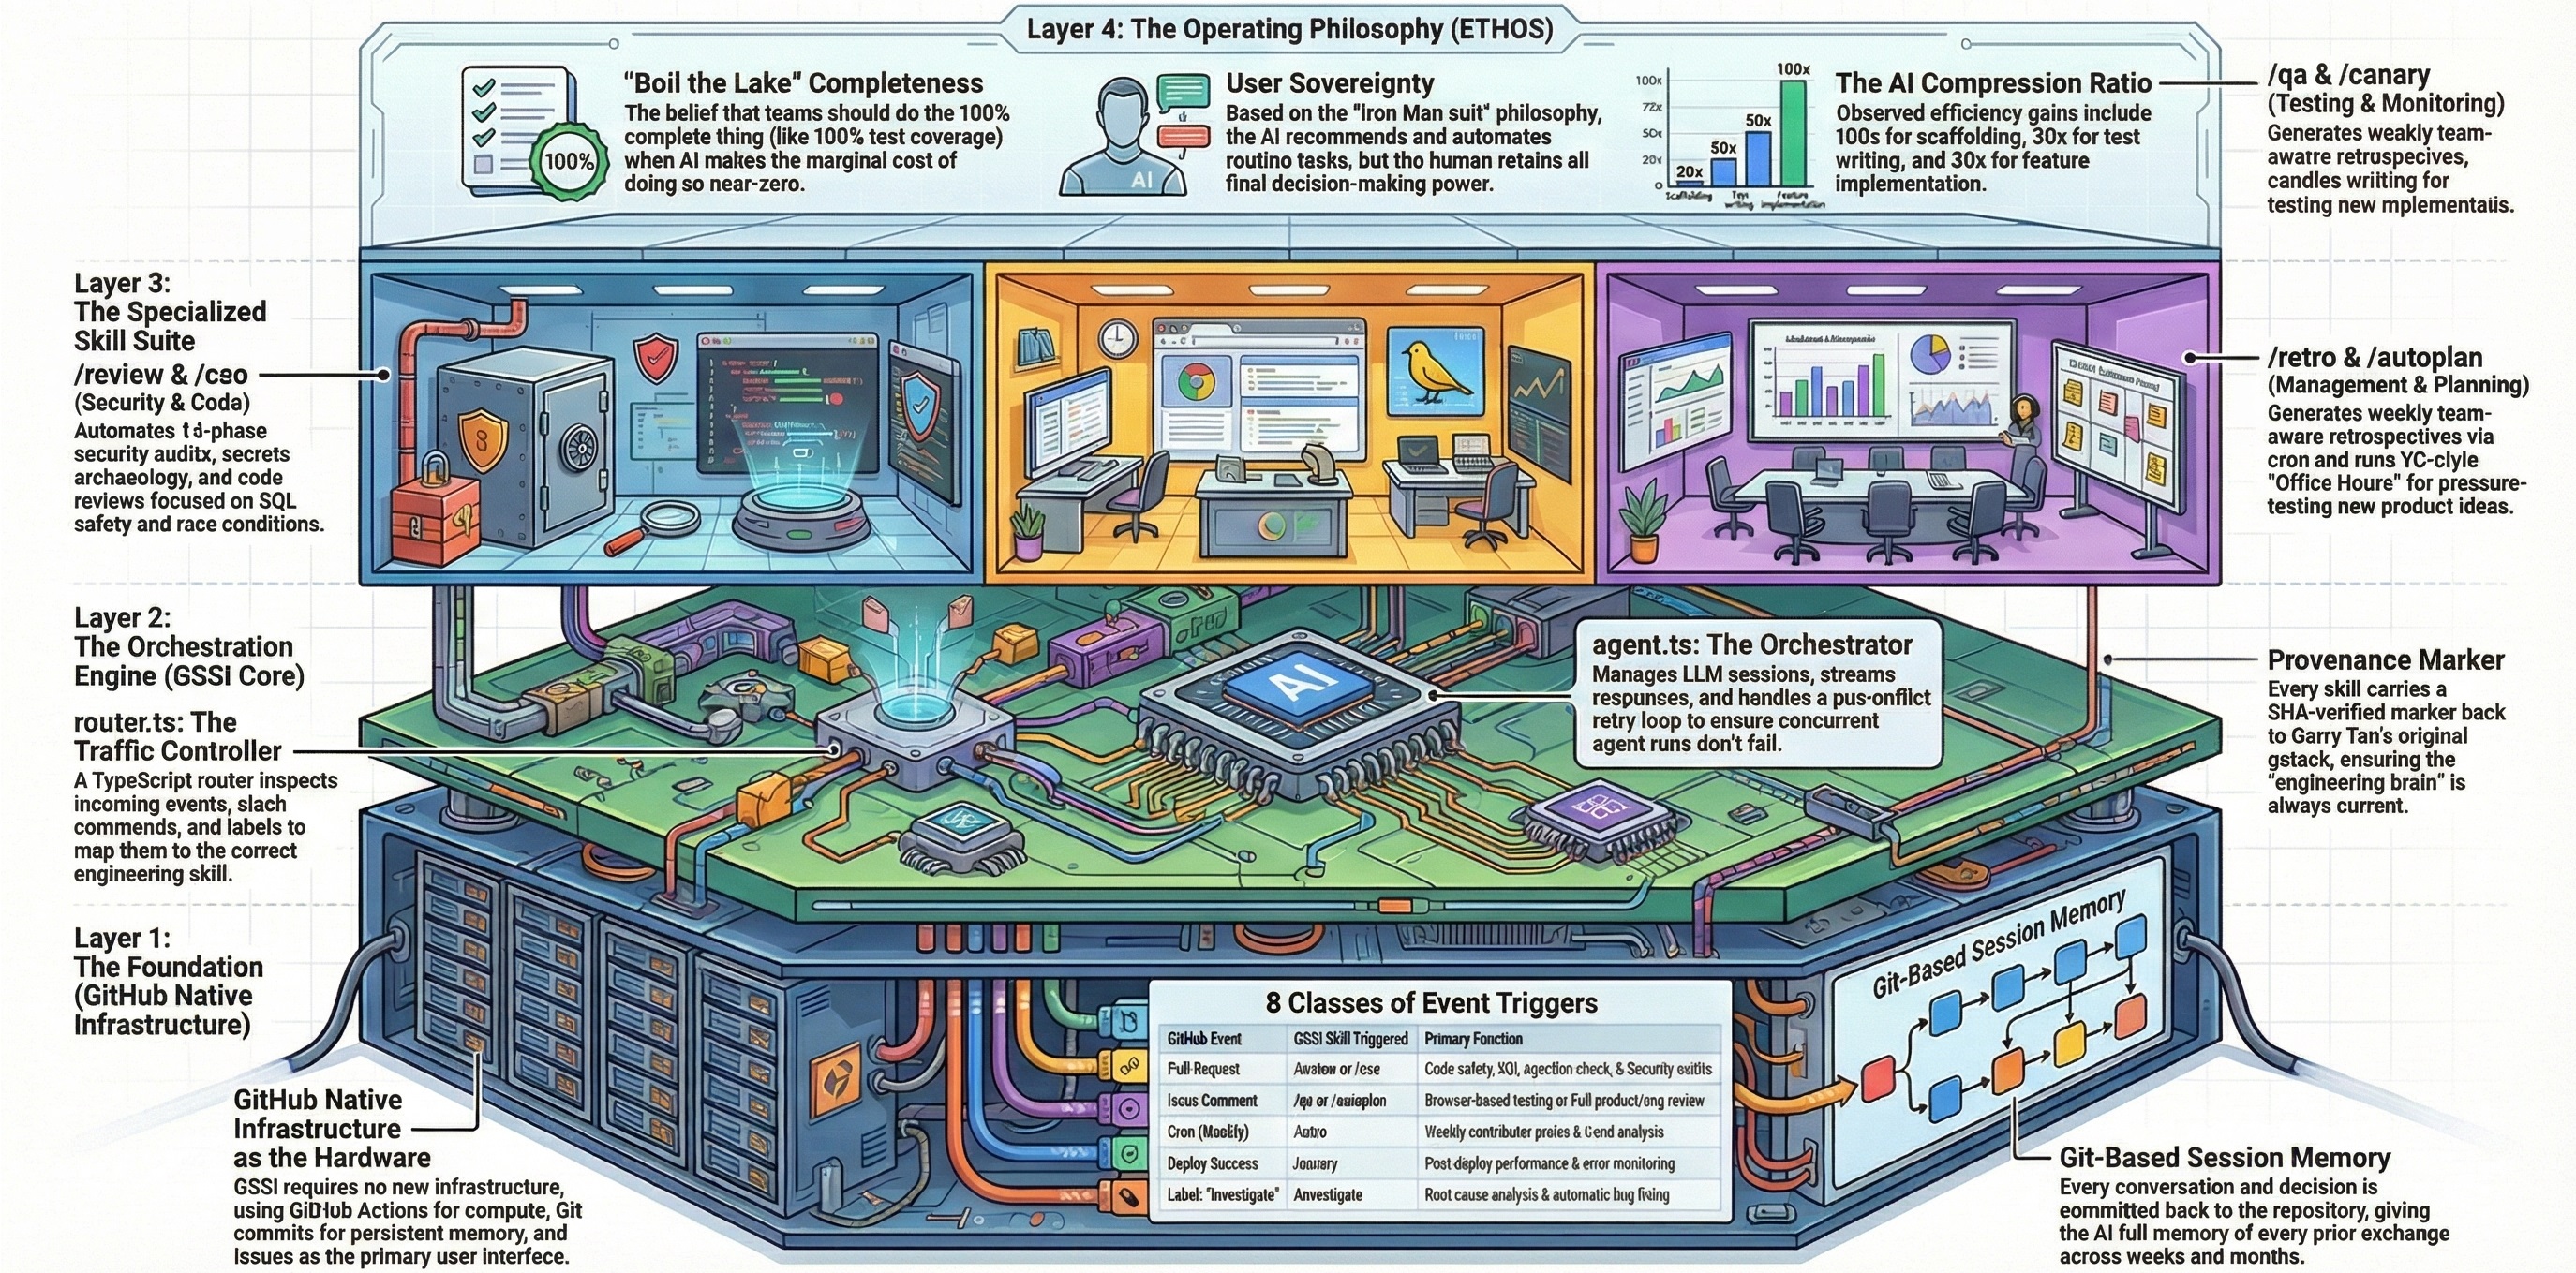
lifecycle/router.ts |
Event routing — maps schedule events and /benchmark slash commands |
/canary— Post-deploy monitoring (complements benchmark with live production checks)/retro— Weekly retrospective (tracks performance trends alongside code quality)/qa— Quality assurance testing with browser automation